

Figure 4. Chlamydia — Rates of Reported Cases by County, United States, 2015
 ShareCompartir
This web page is archived for historical purposes and is no longer being updated. Newer data is available on the STD Data and Statistics page.
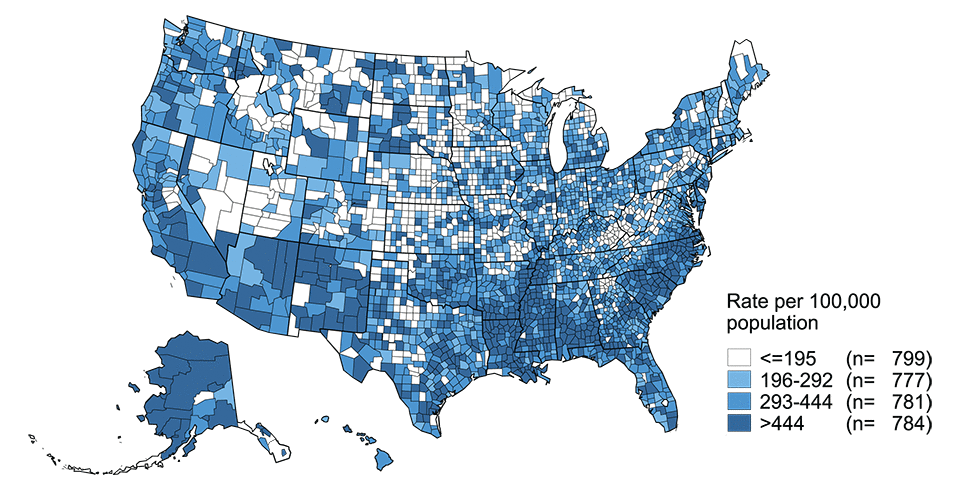
NOTE: Refer to the NCHHSTP Atlas for further county-level rate information: https://www.cdc.gov/nchhstp/atlas/.
- Page last reviewed: October 17, 2016 (archived document)
- Content source: