

Figure M. Gonorrhea — Rate Ratios* by Race/Ethnicity, United States, 2008 – 2012
 ShareCompartir
This web page is archived for historical purposes and is no longer being updated. Newer data is available on the STD Data and Statistics page.
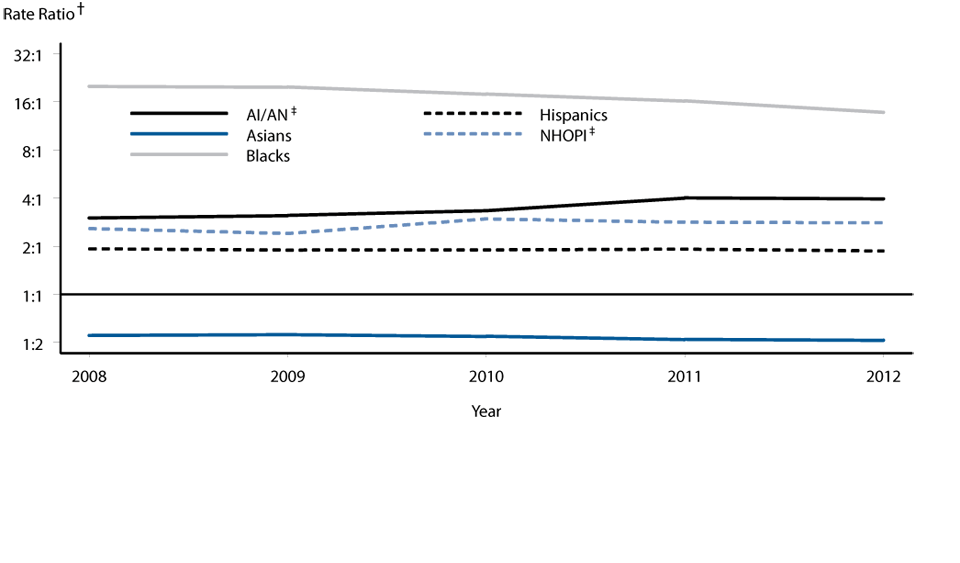
* Rate ratios are calculated as the gonorrhea rate per 100,000 population for a given racial or ethnic minority population divided by the gonorrhea rate per 100,000 population for non-Hispanic whites. Any population with a lower rate of gonorrhea than the non-Hispanic white population will have a rate ratio of less than 1:1.
† Y-axis is log scale.
‡ AI/AN = American Indians/Alaska Natives; NHOPI = Native Hawaiian and Other Pacific Islanders.
NOTE: Includes 38 states and the District of Columbia reporting race/ethnicity data in Office of Management and Budget compliant formats during 2008–2012 (see Appendix “Interpreting STD Surveillance Data”).
- Page last reviewed: January 7, 2014 (archived document)
- Content source: