

Figure N. Gonorrhea — Rates by Race/Ethnicity and Sex, United States, 2012
 ShareCompartir
This web page is archived for historical purposes and is no longer being updated. Newer data is available on the STD Data and Statistics page.
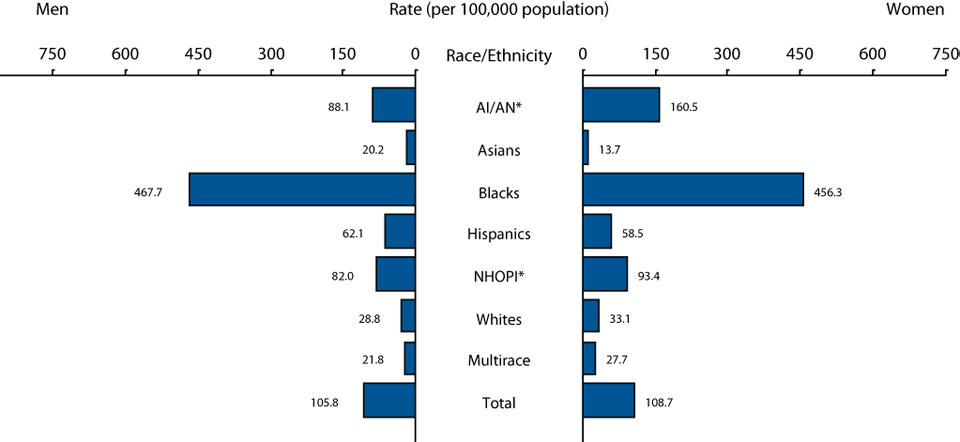
* AI/AN = American Indians/Alaska Natives; NHOPI = Native Hawaiian and Other Pacific Islanders.
NOTE: Includes 47 states and the District of Columbia reporting race/ethnicity data in Office of Management and Budget compliant formats in 2012 (see Appendix “Interpreting STD Surveillance Data”).
- Page last reviewed: January 7, 2014 (archived document)
- Content source: