


Reported cases of rabies in skunks, by county, 2015
 ShareCompartir
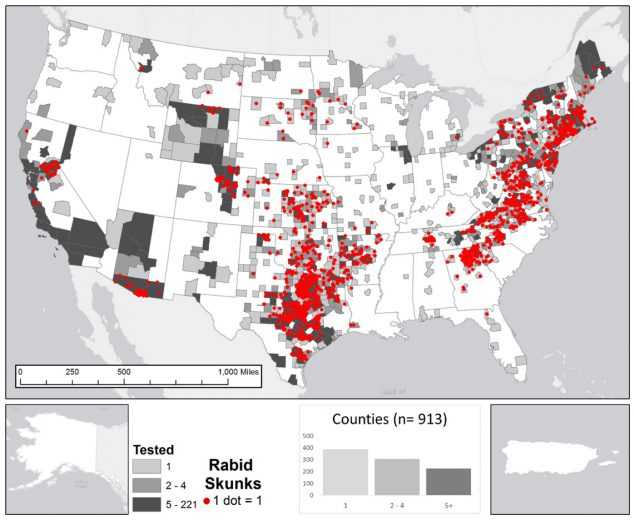
The figure shows a map of the United States with highlighted counties where rabid skunks were tested during 2015. Histogram represents number of counties in each category (light grey for 1 tested animal; medium grey for 2 – 4 tested animals; and dark grey for 5 – 221 tested animals) for total number of skunks submitted for rabies testing. Point locations (red dots) for rabid skunks were randomly selected within each reporting jurisdiction. The majority of cases occur in central and eastern United States. The total number of reported cases involving skunks in 2015 was 1,365, representing 24.8 percent of all wildlife rabies cases in the United States.
- Page last reviewed: July 5, 2017
- Page last updated: July 5, 2017
- Content source: