

NoroSTAT Data
 ShareCompartir
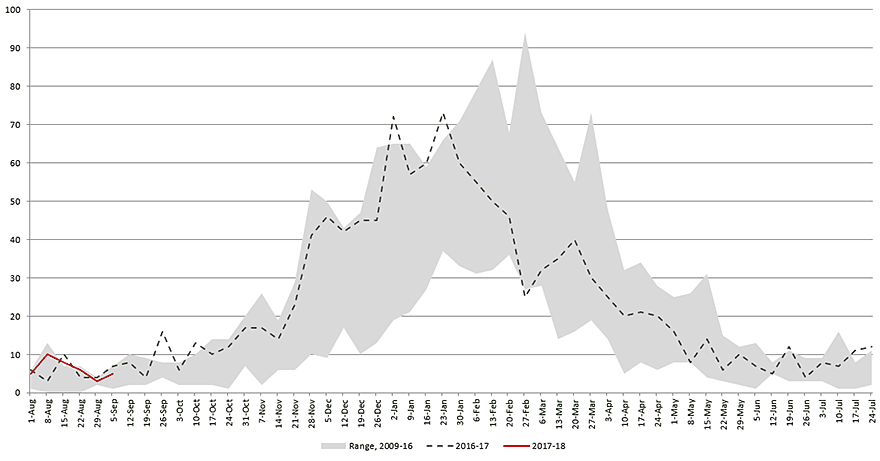
Suspected and Confirmed Norovirus Outbreaks Reported by State Health Departments in Massachusetts, Michigan, Minnesota, Ohio, Oregon, South Carolina, Tennessee, Virginia, and Wisconsin to the National Outbreak Reporting System (NORS) by Week of Illness Onset, 2009-2018*†.
See data table for this chart.
What this graph shows:
- This graph tracks the total number of suspected and confirmed norovirus outbreaks reported each week by states participating in NoroSTAT.
- The gray area represents the highest and lowest number of norovirus outbreaks reported each week for the 2009 through 2016 seasonal years (August–July).
- The green dotted line is data from the last seasonal year (2016-2017).
- The solid red line is the latest data for the current seasonal year (2017-2018). State health departments participating in NoroSTAT have 7 business days to report norovirus outbreaks to CDC.
- A seasonal year’s line that consistently falls above the gray area, especially during the peak of the season (December to March), might indicate unusually high norovirus activity.
More information about the current norovirus season:
- From August 1, 2017 – September 5, 2017, there were 37 norovirus outbreaks reported by NoroSTAT-participating states. During the same period last year, there were 34 norovirus outbreaks reported by these states.
- To see what norovirus genotypes are currently circulating in the United States visit the CaliciNet data page.
- Page last reviewed: June 24, 2016
- Page last updated: September 25, 2017
- Content source: