CaliciNet Data
Number of Confirmed Norovirus Outbreaks Submitted to CaliciNet by State
September 1, 2017 – September 30, 2017
Confirmed Norovirus Outbreaks Submitted to CaliciNet, by Genogroup
September 1, 2016 – September 30, 2017 (n=699)

See data table for this chart.
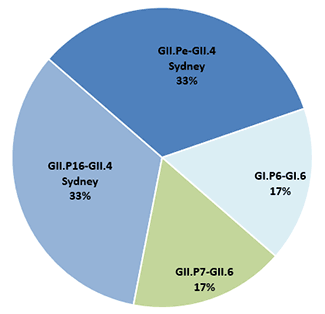
Genotype Distribution of Norovirus Outbreaks
September 1, 2017 – September 30, 2017
(n=6)

See data table for this chart.
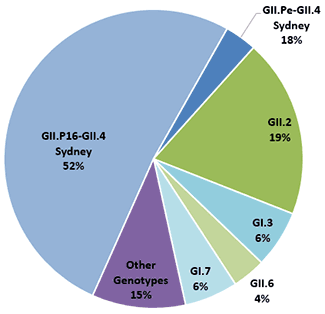
Genotype Distribution of Norovirus Outbreaks
September 1, 2016 – August 30, 2017
(n=693)

See data table for this chart.
* Dual typing for norovirus is being implemented by laboratories participating in CaliciNet. Dual typing is RT-PCR amplification of a partial region of both the polymerase gene and the capsid gene (region B-C) in a single reaction for genogroup I or genogroup II viruses.
- Page last reviewed: June 24, 2016
- Page last updated: October 16, 2017
- Content source:


 ShareCompartir