


OCCUPATIONAL HEALTH SAFETY NETWORK (OHSN)
 ShareCompartir

Data and Injury Trends among OHSN-Participating Facilities
Overview
Annually, NIOSH will analyze data on all injuries recorded in OHSN to determine changes in injury trends among participating healthcare facilities. Through these analyses, we are able to determine injuries with the highest rates among all OHSN-participating facilities. Together, we can identify and target these safety and health issues and propose appropriate recommendations that may benefit the participating hospitals.
Recent Findings
The following charts and information summarize OHSN data collected during January 1, 2012 to December 31, 2014.
Traumatic Injury Rates by Job

Among OHSN-participating facilities, we found:
- During January 1, 2012 to December 31, 2014, 114 participating facilities reported 11,731 OSHA-recordable traumatic injuries to OHSN.
- Nursing assistants had the highest traumatic injury rate, more than twice the rate for all healthcare personnel between 2012 and 2014.
- Traumatic injuries among nurses were increased compared to all healthcare personnel between 2012 and 2014.
- The traumatic injury rate for physicians, dentists, interns and residents was only about a tenth of that for all healthcare personnel between 2012 and 2014.
* Traumatic injuries include patient handling injuries; slip, trip and fall injuries; and workplace violence injuries.
† Incidence rate = (number of injuries/total worker-months for all facilities) x 10,000.
‡ Non-patient care staff are included in all healthcare personnel.
§ CDC. Occupational Traumatic Injuries among Workers in Health Care Facilities — United States, 2012–2014. MMWR 2015; 64(15); 405-410.
¶ Worker-months are the total, combined number of full-time equivalent workers at all facilities multiplied by the number of months worked in the reporting period. For example, a participating facility with 1,000 full-time equivalent workers contributes 12,000 worker-months in a 12-month reporting period. Worker-months are specific for each occupation (e.g., only full-time equivalent nurses are used to calculate rates for nurses).
Traumatic Injury Rates by Job and Type of Injury

Among OHSN-participating facilities, we found:
- Nursing assistants had the highest OSHA-recordable injury incidence rates for patient handling and workplace violence injuries. Patient handling injuries were 3 times higher among nursing assistants compared to all healthcare personnel combined. Workplace violence injuries were 2.5 times higher among nursing assistants compared to all healthcare personnel combined.
- Injuries from patient handling and from workplace violence were higher among nurses compared to all healthcare personnel combined.
- Physicians, dentists, interns and residents had the lowest injury rates for all event types.
* Incidence rate = (number of injuries/total worker-months for all facilities) x 10,000.
† Traumatic injuries include patient handling and movement injuries; slip, trip and fall injuries; and workplace violence injuries.
‡ Non-patient care staff are included in all healthcare personnel.
§ CDC. Occupational Traumatic Injuries among Workers in Health Care Facilities — United States, 2012–2014. MMWR 2015; 64(15); 405-410.
¶ Worker-months are the total, combined number of full-time equivalent workers at all facilities multiplied by the number of months worked in the reporting period. For example, a participating facility with 1,000 full-time equivalent workers contributes 12,000 worker-months in a 12-month reporting period. Worker-months are specific for each occupation (e.g., only full-time equivalent nurses are used to calculate rates for nurses).
Trends in Workplace Violence Injuries by Job
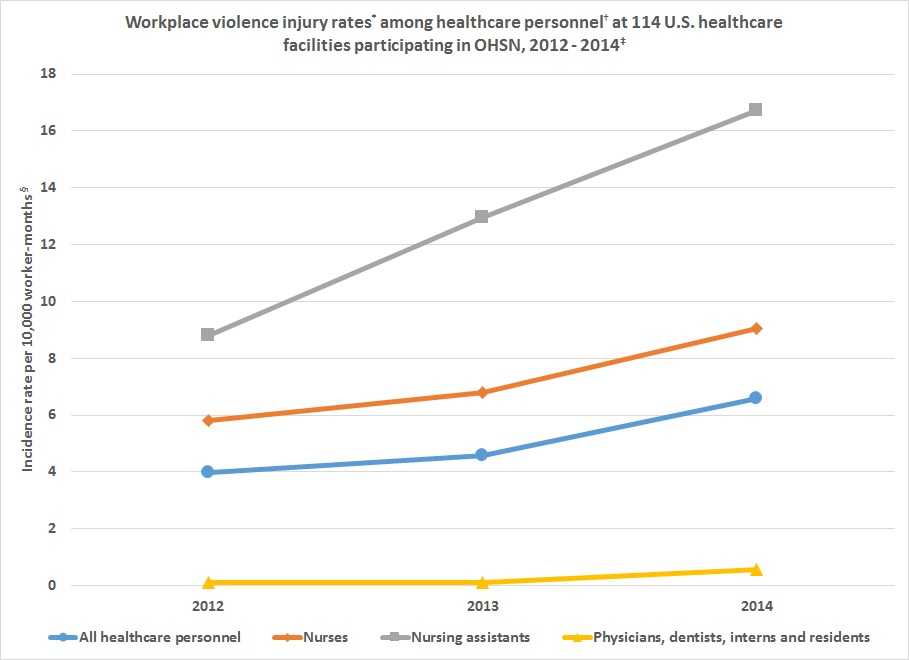
Among OHSN-participating facilities, we found:
- The OSHA-recordable workplace violence injury incidence rate increased 65% for all healthcare personnel during 2012 – 2014.
- Workplace violence injuries among nursing assistants increased annually during 2012-2014.
- Workplace violence injuries increased by 55% among nurses during 2012 - 2014.
- The workplace violence injury rate for physicians, dentists, interns and residents did not change significantly during 2012 - 2014.
* Incidence rate = (number of injuries/total worker-months for all facilities) x 10,000.
† Non-patient care staff are included in all healthcare personnel.
‡ CDC. Occupational Traumatic Injuries among Workers in Health Care Facilities — United States, 2012–2014. MMWR 2015; 64(15); 405-410.
§ Worker-months are the total, combined number of full-time equivalent workers at all facilities multiplied by the number of months worked in the reporting period. For example, a participating facility with 1,000 full-time equivalent workers contributes 12,000 worker-months in a 12-month reporting period. Worker-months are specific for each occupation (e.g., only full-time equivalent nurses are used to calculate rates for nurses).
Workplace Violence Injuries by Type of Incidence
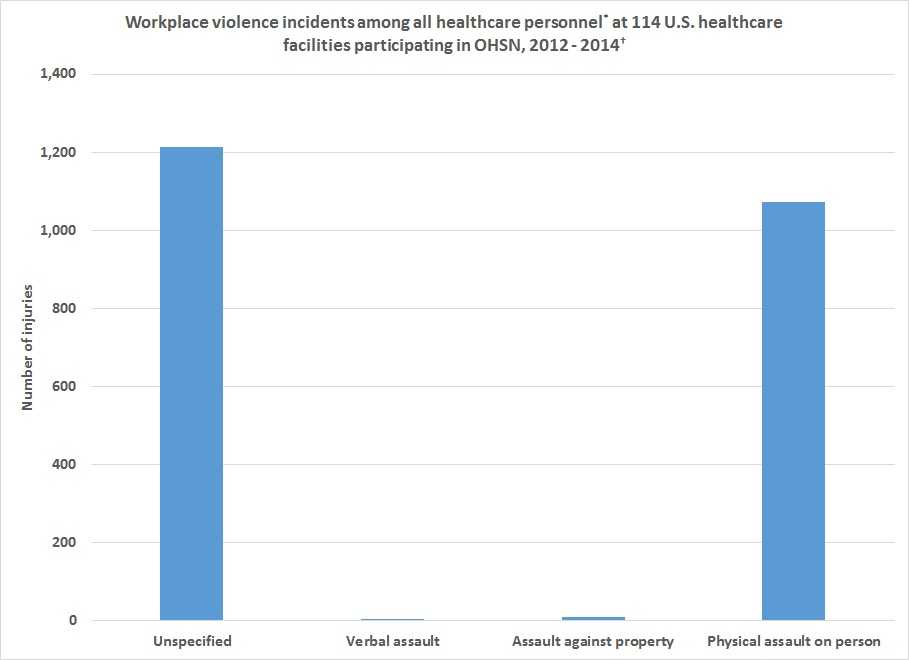
Among OHSN-participating facilities, we found:
- During January 1, 2012 to December 31, 2014, 114 participating facilities reported 2,301 OSHA-recordable workplace violence injuries to OHSN.
- The type of violent incident was not specified in half of these injuries.
- Among those for which incident type was known, almost all involved an actual physical assault on a person. Only 1.5% were associated with verbal assaults and assaults against property.
* Non-patient care staff are included in all healthcare personnel.
† CDC. Occupational Traumatic Injuries among Workers in Health Care Facilities — United States, 2012–2014. MMWR 2015; 64(15); 405-410.
Patient Handling Injuries by Use of Lifting Equipment
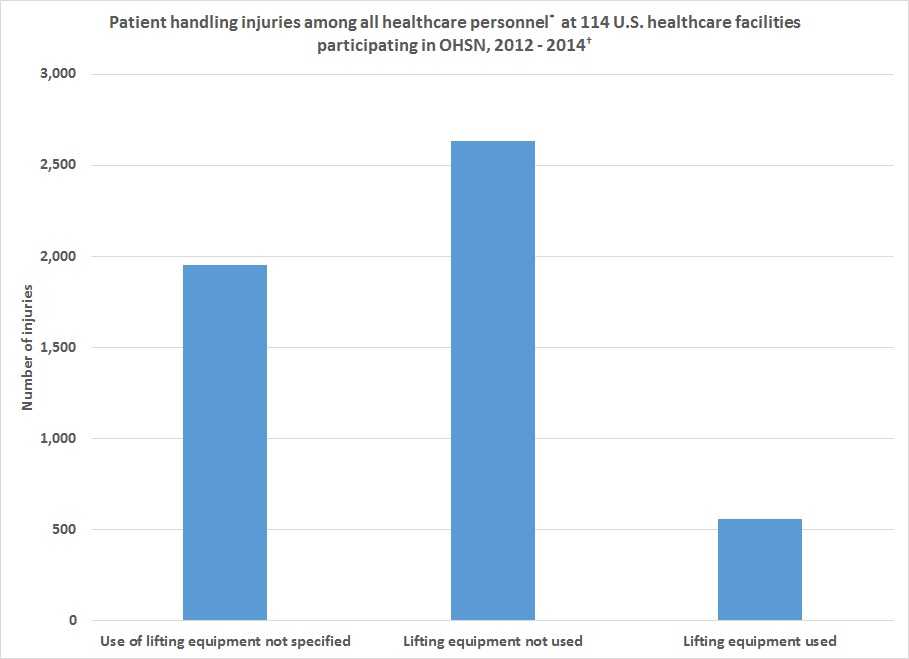
Among OHSN-participating facilities, we found:
- During January 1, 2012 to December 31, 2014, participating facilities reported 5,140 patient handling and movement injuries to OHSN.
- Use of lifting equipment was not specified for 38% of patient handling injuries.
- Among injuries for which lifting equipment use was reported, almost 83% of these injuries occurred when the equipment was not used. About 18% of patient handling injuries occurred when lifting equipment was used.
* Non-patient care staff are included in all healthcare personnel.
† CDC. Occupational Traumatic Injuries among Workers in Health Care Facilities — United States, 2012–2014. MMWR 2015; 64(15); 405-410.
What Healthcare Facilities Can Do to Reduce Workplace Injuries
- Nursing assistants and nurses have the highest injury rates of all occupational groups.
- Targeting institutional prevention strategies to nursing staff can protect health care personnel, reduce overall injury rates and help to manage resources efficiently.
- Prevention measures should concentrate on reducing and preventing the high-risk aspects of nursing.
- Patient handling events account for the highest number and rate of injuries among patient care personnel as well as all healthcare personnel combined. The majority of these injuries occur when lifting equipment is not used.
- Training, and dedicating resources for safe patient handling (e.g. access to lifting teams and lifting equipment), may reduce patient handling injuries, particularly for activities involving positioning, transferring or lifting patients.
- Injuries resulting from workplace violence appears to be increasing among all healthcare personnel and particularly among nursing assistants and nurses. The majority of these injuries result from physical assaults on nursing staff.
- Workplace violence prevention resources may help to reverse this trend. This could include
- training for hospital staff to recognize patients at risk for committing violent acts (e.g. patients with mental illness, behavioral disorders and cognitive dysfunction)
- ways to moderate and prevent violent patient behavior
- Workplace violence prevention resources may help to reverse this trend. This could include
Recent Publications
CDC. Occupational Traumatic Injuries among Workers in Health Care Facilities — United States, 2012–2014. MMWR 2015; 64(15); 405-410.
- Page last reviewed: January 4, 2017
- Page last updated: January 4, 2017
- Content source:
- National Institute for Occupational Safety and Health Division of Surveillance, Hazard Evaluations, and Field Studies