

Learn More about CDC’s Childhood Lead Poisoning Data
 ShareCompartir
Funded health departments are required to provide data to CDC; other health departments are not.
These data have limitations, and we cannot compare across states or counties.
A blood lead test is the best way to measure lead exposure. Children are given a blood test to determine the level of lead in their blood.
The amount of lead in blood is referred to as blood lead level (BLL). BLLs are measured in micrograms of lead per deciliter of blood (μg/dL).
There is no known safe BLL. Exposure to lead can seriously harm a child’s health. Millions of children are being exposed to lead in their homes, increasing their risks for
- damage to the brain and nervous system,
- slowed growth and development,
- learning and behavior problems (e.g., reduced IQ, ADHD, juvenile delinquency, and criminal behavior), and
- hearing and speech problems.
CDC Data
CDC began collecting childhood blood lead surveillance data in April 1995.
CDC funds 35 state and local health departments for lead surveillance. As part of their funding agreement, awardees (grantees) are required to report data to us on a quarterly basis. Data reporting is voluntary in states we don’t fund. We do not have a contract or other mechanism to require reporting, and in many of the states we don’t fund, there are no staff to do this work.
- The 29 funded states are Arizona, Colorado, Connecticut, Delaware, Georgia, Illinois, Indiana, Kentucky, Louisiana, Maryland, Massachusetts, Michigan, Minnesota, Mississippi, Missouri, New Hampshire, New Jersey, New Mexico, New York State, North Carolina, Ohio, Oklahoma, Oregon, Rhode Island, Tennessee, Vermont, Washington, West Virginia, and Wisconsin.
- Washington, DC.
- The five cities are Chicago, Houston, Los Angeles, New York City, and Philadelphia.
CDC uses data from states to prepare the State Surveillance Data and the National Surveillance Data. These data are from funded states as well as states that volunteer to send us their data.
-
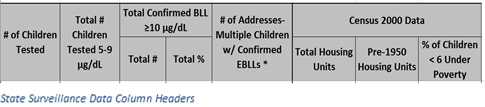
The State Surveillance Data page (above) shows county-level summary data including the number of addresses where multiple children have had confirmed elevated blood lead levels and data from the 2000 census. -
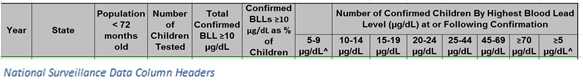
The National Surveillance Data page (above) shows data summarized by year and broken down by highest BLL at or after confirmation. This chart represents data reported by state to the national surveillance system over the past several years. The chart represents only state-specific data and is not a population-based estimate, so we are not able to compare states against one another.
All states funded by CDC, except Indiana and Kentucky, have state laws that require clinical laboratories to report all BLLs to their state health department.
CDC grantees annually report
- Data on blood lead testing and follow-up of children identified with high BLLs,
- Lead hazard identification, control, and abatement activities in their jurisdictions, and
- Proposed interventions for high-risk areas.
States collect the lead poisoning data through a variety of sources including
- Both public and private labs,
- State and local housing authorities,
- State and local environmental protection agencies, and
- State and local education agencies.
Limitations of the Data
Analyses and generation of surveillance reports require considerable time and human intervention, so data are not always sent to CDC in a timely manner. Even so, about 2.5 million blood lead tests are received by CDC each year and are grouped into a reportable surveillance format after careful cleaning and deduplication to ensure only one test per individual.
Once CDC gets and cleans the data, we are able to look at it by county. Data collection methods vary among states, so CDC cannot accurately compare data across counties or states.
The childhood BLL data on CDC’s website are not a population-based estimate: These data are not representative of a whole county or a whole state; they are designed to target resources to the highest-risk areas. Programs work hard to test children most likely to have high BLLs.
Programs vary in the number of children tested and the number of children identified with high blood levels because of a variety of factors. These data cannot be accurately compared between or among states and counties. Percentage comparisons can be affected by
- county size,
- number of children tested within the counties, and
- number of children in the counties who are reported to have high BLLs. For example, some counties may have a small number of children tested, but many of those tested have high BLLs.
Some statistics could underestimate the number of children with lead exposure because not all children are tested.
How Health Agencies Use CDC’s Data
Health agencies using CDC’s surveillance system or another childhood lead poisoning surveillance and data collection system can
- Identify remaining at-risk geographic areas,
- Identify at-risk children to target testing and limited resources,
- Identify emerging sources of exposure and inform strategic plans to remove or reduce sources,
- Evaluate timeliness and efficacy of case management services available to children with lead poisoning and work with inspectors and risk assessors to ensure safe living environments, and
- Target pediatric health care provider education efforts.
About NHANES
The National Health and Nutrition Examination Survey (NHANES) is a population-based survey to assess the health and nutritional status of adults and children in the United States. CDC’s state-based data are not comparable to data in NHANES.
CDC analyzed data from NHANES from the periods 1999–2002 to 2007–2010 to determine the 97.5th percentile of blood lead distribution in children and determine the reference value (currently 5 µg/dL). Using a reference value gives us a way to identify children with blood lead levels that are much higher than most children’s levels.
Overall Declining Trend in BLLs
BLLs have continued to decline in the last 30 years, even in the most high-risk areas. The overall declining trend in the percentage of children detected with BLLs at or above the reference value is in keeping with the national population-based estimate from NHANES, which has also declined over time. BLLs in U.S. children continue to decrease, most likely as a result of an intense coordinated effort to control or eliminate lead sources in children’s environments by government officials, health care and social service providers, and the communities most at risk.
For More Information
Blood Lead Levels in Children Aged 1–5 Years — United States, 1999–2010, https://www.cdc.gov/mmwr/preview/mmwrhtml/mm6213a3.htm?s_cid=mm6213a3_e
CDC State Surveillance Data webpage showing county-level summary data, https://www.cdc.gov/nceh/lead/data/state.htm
CDC National Surveillance Data webpage showing state summary data by year, https://www.cdc.gov/nceh/lead/data/national.htm
CDC's Childhood Lead Poisoning Prevention Program, https://www.cdc.gov/nceh/lead/about/program.htm
- Page last reviewed: March 25, 2016
- Page last updated: May 4, 2016
- Content source:
National Center for Environmental Health, Division of Emergency and Environmental Health Services