

State-based Prevalence Data of Parent Reported ADHD Diagnosis by a Health Care Provider
 ShareCompartir
On this Page
The data on this page are from the study:
“Trends in the Parent-Report of Health Care Provider-Diagnosed and Medicated ADHD: United States, 2003—2011.” [Read Summary]
Learn more about the data source: National Survey of Children’s Health
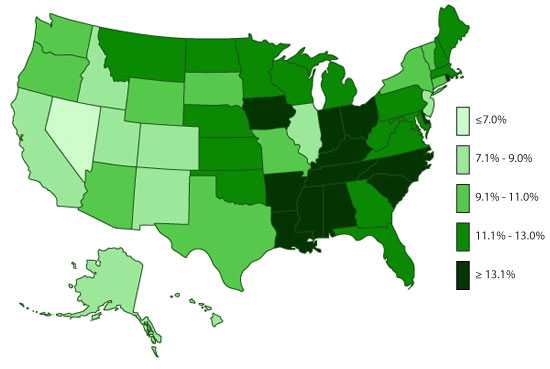
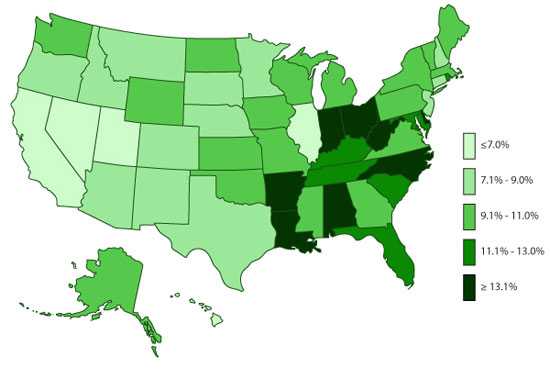
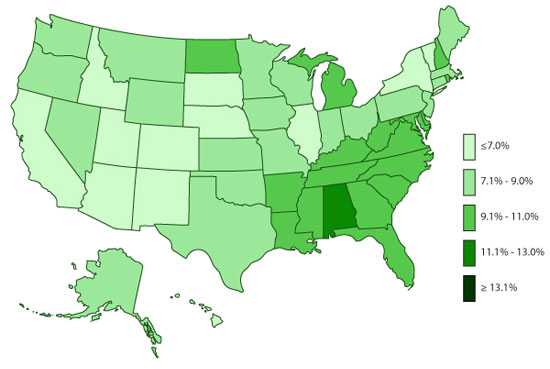
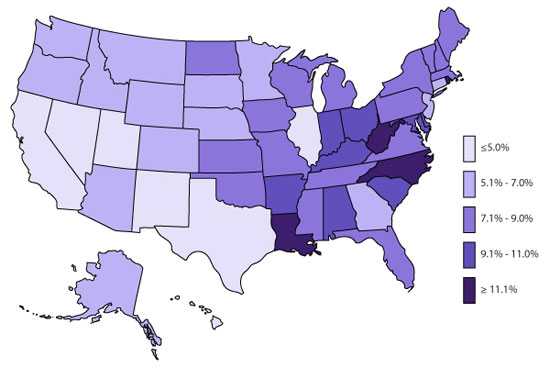
Percent of Youth Aged 4-17 Ever Diagnosed with Attention-Deficit/Hyperactivity Disorder by State: National Survey of Children's Health
2011
2007
2003
Ever Diagnosed – Parent Report |
|||||||||
|---|---|---|---|---|---|---|---|---|---|
|
State |
2003 |
2007 |
2011 |
State |
2003 |
2007 |
2011 |
||
|
Alabama |
11.1 |
14.3 |
14.0 |
Montana |
7.1 |
8.5 |
11.7 |
||
|
Alaska |
7.1 |
9.2 |
8.8 |
Nebraska |
6.4 |
9.0 |
11.6 |
||
|
Arkansas |
9.9 |
13.1 |
17.0 |
Nevada |
7.2 |
5.6 |
5.6 |
||
|
Arizona |
5.9 |
7.6 |
10.1 |
New Hampshire |
9.2 |
8.5 |
11.9 |
||
|
California |
5.3 |
6.2 |
7.3 |
New Jersey |
7.2 |
9.0 |
7.8 |
||
|
Colorado |
5 |
7.6 |
7.1 |
New Mexico |
6.1 |
7.1 |
7.5 |
||
|
Connecticut |
7.3 |
7.8 |
9.7 |
New York |
6.3 |
9.2 |
9.9 |
||
|
Delaware |
9.8 |
14.1 |
14.3 |
North Carolina |
9.6 |
15.6 |
14.4 |
||
|
District of Columbia |
6.7 |
7.7 |
9.7 |
North Dakota |
9.4 |
10.0 |
11.6 |
||
|
Florida |
9.2 |
11.6 |
11.2 |
Ohio |
8.9 |
13.3 |
14.2 |
||
|
Georgia |
9.4 |
9.2 |
12.1 |
Oklahoma |
8.1 |
11.0 |
11.9 |
||
|
Hawaii |
6.2 |
6.3 |
8.5 |
Oregon |
7.2 |
8.8 |
10.8 |
||
|
Idaho |
6.4 |
8.3 |
8.6 |
Pennsylvania |
8.2 |
10.2 |
11.2 |
||
|
Illinois |
6.3 |
6.2 |
9.0 |
Rhode Island |
9.8 |
11.1 |
13.4 |
||
|
Indiana |
7.9 |
13.2 |
15.7 |
South Carolina |
10 |
12.0 |
15.7 |
||
|
Iowa |
8.4 |
9.7 |
13.7 |
South Dakota |
6.5 |
8.1 |
9.1 |
||
|
Kansas |
8.1 |
10.0 |
11.6 |
Tennessee |
9.9 |
11.3 |
15.2 |
||
|
Kentucky |
10.1 |
12.4 |
18.7 |
Texas |
7.7 |
7.7 |
10.1 |
||
|
Louisiana |
10.3 |
14.2 |
15.8 |
Utah |
5.5 |
6.7 |
8.3 |
||
|
Maine |
7.9 |
9.6 |
12.9 |
Vermont |
6.9 |
9.9 |
10.5 |
||
|
Maryland |
9.1 |
11.9 |
11.8 |
Virginia |
9.3 |
10.2 |
11.8 |
||
|
Massachusetts |
8.5 |
9.8 |
11.3 |
Washington |
7.2 |
9.5 |
9.8 |
||
|
Michigan |
9.2 |
9.9 |
12.8 |
West Virginia |
10.1 |
13.3 |
11.9 |
||
|
Minnesota |
7.5 |
7.8 |
11.5 |
Wisconsin |
8.1 |
9.9 |
12.5 |
||
|
Mississippi |
9.6 |
9.9 |
14.0 |
Wyoming |
7.1 |
9.1 |
9.7 |
||
|
Missouri |
7.7 |
10.8 |
9.8 |
US |
7.8 |
9.5 |
11.0 |
||
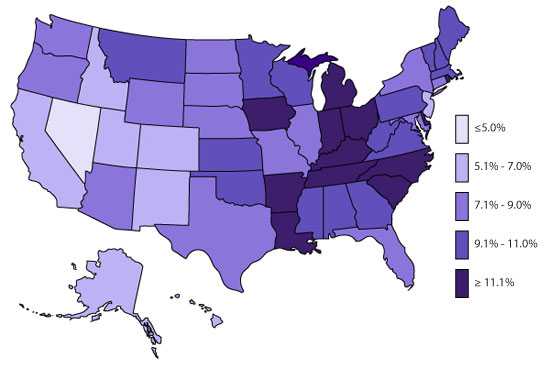
Percent of Youth Aged 4-17 with Current Attention-Deficit/Hyperactivity Disorder by State: National Survey of Children's Health
2011
2007
Note: data on current ADHD were not collected in 2003.
Currently Diagnosed |
|||||
|---|---|---|---|---|---|
|
State |
2007 |
2011 |
State |
2007 |
2011 |
|
Alabama |
9.7 |
10.6 |
Montana |
6.3 |
9.1 |
|
Alaska |
6.0 |
6.0 |
Nebraska |
6.5 |
8.1 |
|
Arkansas |
10.9 |
14.6 |
Nevada |
3.7 |
4.2 |
|
Arizona |
5.9 |
8.2 |
New Hampshire |
7.2 |
10.1 |
|
California |
4.6 |
5.9 |
New Jersey |
6.9 |
5.5 |
|
Colorado |
5.2 |
5.6 |
New Mexico |
4.3 |
6.2 |
|
Connecticut |
5.5 |
7.6 |
New York |
7.5 |
7.7 |
|
Delaware |
10.9 |
11.7 |
North Carolina |
12.8 |
11.6 |
|
District of Columbia |
5.8 |
7.9 |
North Dakota |
7.5 |
8.9 |
|
Florida |
8.9 |
8.5 |
Ohio |
9.4 |
11.6 |
|
Georgia |
6.9 |
9.3 |
Oklahoma |
8.4 |
9.9 |
|
Hawaii |
4.5 |
6.0 |
Oregon |
6.8 |
7.9 |
|
Idaho |
6.6 |
6.7 |
Pennsylvania |
7.9 |
9.3 |
|
Illinois |
4.8 |
7.2 |
Rhode Island |
9.4 |
11.1 |
|
Indiana |
9.3 |
13.0 |
South Carolina |
9.5 |
11.7 |
|
Iowa |
7.6 |
11.5 |
South Dakota |
6.6 |
7.4 |
|
Kansas |
7.6 |
9.5 |
Tennessee |
8.7 |
11.1 |
|
Kentucky |
10.2 |
14.8 |
Texas |
4.8 |
9.0 |
|
Louisiana |
11.7 |
13.3 |
Utah |
4.8 |
5.8 |
|
Maine |
7.3 |
10.1 |
Vermont |
7.8 |
9.4 |
|
Maryland |
9.1 |
8.9 |
Virginia |
8.2 |
9.1 |
|
Massachusetts |
8.0 |
9.6 |
Washington |
6.7 |
8.0 |
|
Michigan |
8.2 |
11.2 |
West Virginia |
11.1 |
9.9 |
|
Minnesota |
6.5 |
9.7 |
Wisconsin |
7.6 |
10.4 |
|
Mississippi |
7.3 |
10.9 |
Wyoming |
6.7 |
7.2 |
|
Missouri |
8.6 |
8.4 |
US |
7.2 |
8.8 |
Related Links
- Page last reviewed: February 7, 2017
- Page last updated: February 13, 2017
- Content source: