

State-based Prevalence Data of Parent Reported ADHD Medication Treatment
 ShareCompartir
The data on this page are from the study:
“Trends in the Parent-Report of Health Care Provider-Diagnosed and Medicated ADHD: United States, 2003—2011.” [Read Summary]
Learn more about the data source: National Survey of Children’s Health
Percent of Youth Aged 4-17 Years Currently Taking Medication for ADHD by State: National Survey of Children's Health
2011
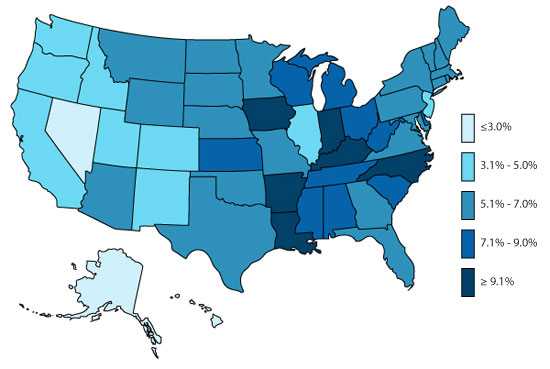
2007
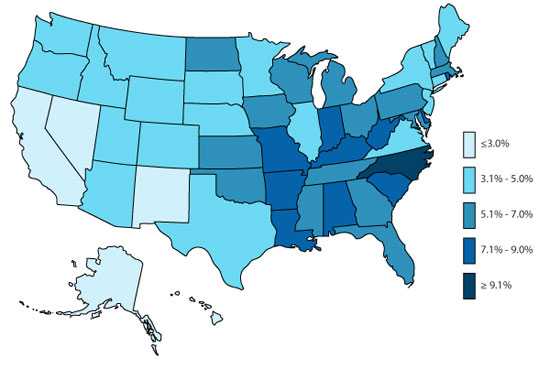
Medicated |
|||||
|---|---|---|---|---|---|
|
State |
2007 |
2011 |
State |
2007 |
2011 |
|
Alabama |
7.2 |
8.3 |
Montana |
3.7 |
6.0 |
|
Alaska |
2.4 |
3.5 |
Nebraska |
4.3 |
7.0 |
|
Arkansas |
7.5 |
9.9 |
Nevada |
1.2 |
2.0 |
|
Arizona |
3.5 |
5.6 |
New Hampshire |
5.3 |
6.5 |
|
California |
2.3 |
3.3 |
New Jersey |
3.6 |
3.5 |
|
Colorado |
3.8 |
3.6 |
New Mexico |
2.9 |
4.1 |
|
Connecticut |
3.6 |
5.1 |
New York |
3.9 |
5.2 |
|
Delaware |
7.3 |
8.0 |
North Carolina |
9.4 |
9.4 |
|
District of Columbia |
3.2 |
4.2 |
North Dakota |
5.1 |
6.8 |
|
Florida |
6.2 |
6.0 |
Ohio |
5.7 |
7.7 |
|
Georgia |
5.2 |
6.1 |
Oklahoma |
5.8 |
6.9 |
|
Hawaii |
2.5 |
3.2 |
Oregon |
4.5 |
4.6 |
|
Idaho |
4.2 |
4.2 |
Pennsylvania |
5.6 |
6.2 |
|
Illinois |
3.5 |
4.1 |
Rhode Island |
7.1 |
6.3 |
|
Indiana |
6.8 |
9.9 |
South Carolina |
6.9 |
7.3 |
|
Iowa |
5.9 |
9.2 |
South Dakota |
4.5 |
5.4 |
|
Kansas |
5.5 |
7.3 |
Tennessee |
6.2 |
8.5 |
|
Kentucky |
7.1 |
10.1 |
Texas |
3.4 |
6.9 |
|
Louisiana |
8.3 |
10.4 |
Utah |
3.1 |
3.5 |
|
Maine |
4.6 |
6.6 |
Vermont |
4.2 |
6.6 |
|
Maryland |
6.1 |
5.8 |
Virginia |
4.8 |
6.6 |
|
Massachusetts |
5.7 |
6.5 |
Washington |
4.1 |
5.0 |
|
Michigan |
5.1 |
8.3 |
West Virginia |
7.8 |
7.3 |
|
Minnesota |
4.6 |
6.5 |
Wisconsin |
5.8 |
8.1 |
|
Mississippi |
5.8 |
7.5 |
Wyoming |
4.5 |
5.4 |
|
Missouri |
6.7 |
6.4 |
US |
4.8 |
6.1 |
Percent of Youth Aged 4-17 Currently with ADHD Receiving Medication Treatment by State: National Survey of Children's Health
2011
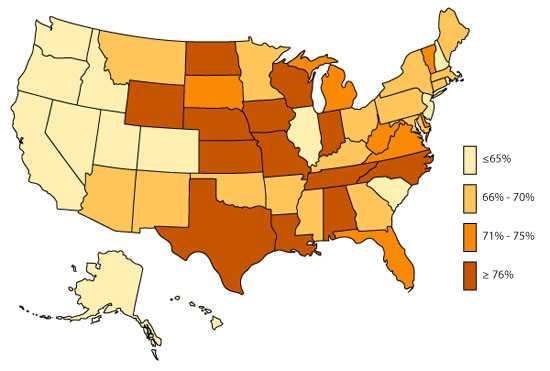
2007
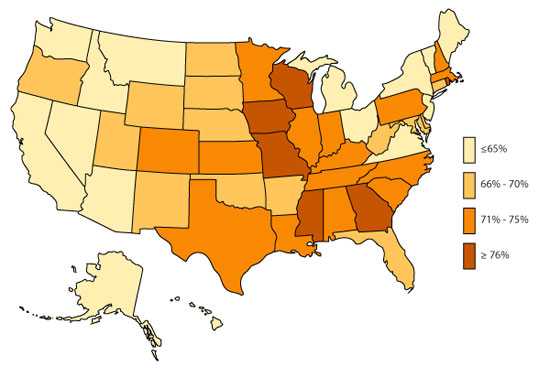
Diagnosed & Medicated |
|||||
|
State |
2007 |
2011 |
State |
2007 |
2011 |
|
Alabama |
74.8 |
78.3 |
Montana |
59.5 |
65.8 |
|
Alaska |
40.7 |
58.6 |
Nebraska |
66.9 |
86.2 |
|
Arkansas |
69.2 |
68.2 |
Nevada |
33.3 |
47.0 |
|
Arizona |
60.3 |
67.9 |
New Hampshire |
74.3 |
64.3 |
|
California |
49.1 |
55.8 |
New Jersey |
52.9 |
64.5 |
|
Colorado |
73.0 |
64.1 |
New Mexico |
67.2 |
65.7 |
|
Connecticut |
65.5 |
67.3 |
New York |
52.4 |
67.3 |
|
Delaware |
66.8 |
70.1 |
North Carolina |
74.4 |
81.0 |
|
District of Columbia |
56.4 |
53.2 |
North Dakota |
68.3 |
76.1 |
|
Florida |
69.1 |
70.1 |
Ohio |
61.1 |
66.8 |
|
Georgia |
76.1 |
65.1 |
Oklahoma |
69.2 |
69.2 |
|
Hawaii |
56.6 |
53.1 |
Oregon |
66.4 |
58.5 |
|
Idaho |
63.1 |
62.0 |
Pennsylvania |
70.3 |
66.6 |
|
Illinois |
74.5 |
56.5 |
Rhode Island |
75.8 |
56.7 |
|
Indiana |
73.2 |
76.8 |
South Carolina |
73.0 |
62.0 |
|
Iowa |
78.2 |
80.1 |
South Dakota |
67.5 |
73.8 |
|
Kansas |
73.0 |
77.7 |
Tennessee |
71.8 |
76.8 |
|
Kentucky |
70.4 |
68.0 |
Texas |
71.9 |
76.5 |
|
Louisiana |
70.7 |
78.7 |
Utah |
65.2 |
60.3 |
|
Maine |
63.9 |
65.2 |
Vermont |
53.2 |
70.3 |
|
Maryland |
66.5 |
65.7 |
Virginia |
58.6 |
71.9 |
|
Massachusetts |
71.8 |
67.6 |
Washington |
61.3 |
62.8 |
|
Michigan |
62.5 |
73.9 |
West Virginia |
70.0 |
73.6 |
|
Minnesota |
71.1 |
66.9 |
Wisconsin |
76.4 |
77.6 |
|
Mississippi |
79.0 |
68.7 |
Wyoming |
67.9 |
75.0 |
|
Missouri |
78.3 |
76.6 |
US |
66.3 |
69.0 |
- Page last reviewed: February 7, 2017
- Page last updated: February 13, 2017
- Content source: