

Basic Statistics
 ShareCompartir
 HIV and AIDS remain a persistent problem for the United States and countries around the world. While great progress has been made in preventing and treating HIV, there is still much to do. The questions in this section provide a broad overview of the effects of HIV and AIDS in the United States and globally. For more detailed analysis of HIV data and its impact in the United States, visit our Statistics Center.
How many people are diagnosed with HIV each year in the United States?
In 2014, an estimated 44,073 people were diagnosed with HIV. The annual number of new diagnoses declined by 19% from 2005 to 2014.
How many people are living with HIV in the United States?
About 1.2 million people in the United States were living with HIV at the end of 2012, the most recent year for which this information is available. Of those people, about 13%, or 1 in 8, did not know they were infected.
How does CDC know who is infected but does not know it?
CDC estimates the number of people living with HIV (called prevalence) by using a scientific model. This model helps CDC estimate the number of new HIV infections and how many people are infected but don’t know it. HIV prevalence is the number of people living with HIV infection at a given time, such as at the end of a given year. More information on HIV prevalence.
How does HIV affect different groups of people?
There are different ways to answer this question.
If we look at HIV diagnoses by race and ethnicity, we see that African Americans are most affected by HIV. In 2014, African Americans made up only 12%* of the US population but had 44% of all new HIV diagnoses. Additionally, Hispanic/Latinos** are also strongly affected. They made up 17% of the US population but had 23% of all new HIV diagnoses.
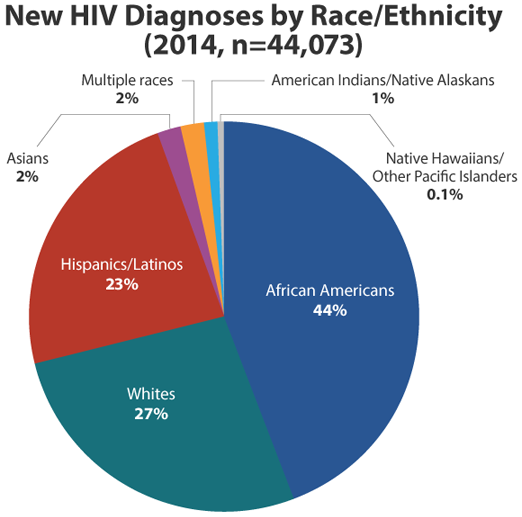
* Does not include blacks/African Americans who are Hispanic
** Hispanics/Latinos can be of any race
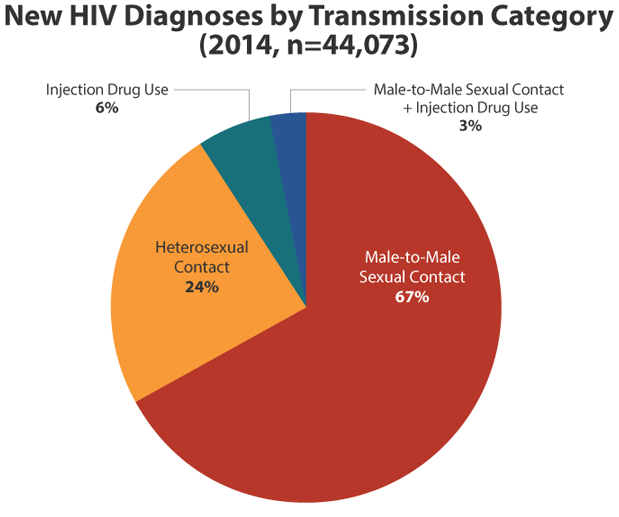
If we look at HIV diagnoses by how people got the virus (transmission category), we see that gay and bisexual men are most at risk. In 2014, gay and bisexual men accounted for 67% of all new HIV diagnoses. In the same year, individuals infected through heterosexual sex made up 24% of all new HIV diagnoses.
Combining those two views allows us to see the most affected populations, by race and by risk factor.
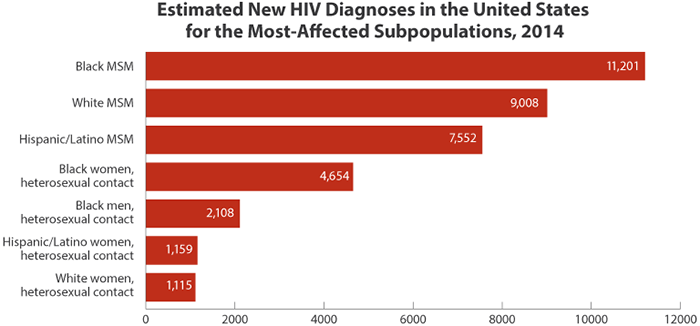
MSM = men who have sex with men (male-to-male sexual contact)
There are also variations by age. Young people aged 13-24 are especially affected by HIV. In 2014, they comprised 16% of the US population but accounted for 22% of all new HIV diagnoses. All young people are not equally at risk, however. Young gay and bisexual men accounted for 92% of all new HIV diagnoses in people aged 13-24 in 2014, and young, African American gay and bisexual men are even more severely affected.
CDC’s fact sheets explain the impact of HIV on various populations in the United States.
Do people still die from HIV?
Yes. In the United States, 6,955 people died from HIV and AIDS in 2013. HIV remains a significant cause of death for certain populations. In 2013, it was the 8th leading cause of death for those aged 25-34, 9th for those aged 35-44, and 10th for those aged 45-54.
Do some parts of the country have more HIV than other parts?
Yes. HIV is largely an urban disease, with most cases occurring in metropolitan areas with 500,000 or more people. The South has the highest number of people living with HIV, but if population size is taken into account, the Northeast has the highest rate of people living with HIV. (Rates are the number of cases of disease per 100,000 people. Rates allow comparisons between groups of different sizes.)
HIV and AIDS in the United States by Geographic Distribution is a fact sheet that explains the geography of HIV in the United States.
What about HIV around the world?
HIV disease continues to be a serious health issue for parts of the world. Worldwide, there were about 2.1 million new cases of HIV in 2015. About 36.7 million people are living with HIV around the world, and as of June 2016, 17 million people living with HIV were receiving medicines to treat HIV, called antiretroviral therapy (ART). An estimated 1.1 million people died from AIDS-related illnesses in 2015. Sub-Saharan Africa, which bears the heaviest burden of HIV/AIDS worldwide, accounts for 65% of all new HIV infections. Other regions significantly affected by HIV/AIDS include Asia and the Pacific, Latin America and the Caribbean, and Eastern Europe and Central Asia.
CDC's Global AIDS website explains what CDC is doing in the global fight against HIV.
Interested in learning more about CDC's HIV statistics?
- Terms, Definitions, and Calculations Used in CDC HIV Surveillance Publications
- Surveillance Overview (information about CDC’s HIV and AIDS surveillance activities)
- HIV Surveillance Reports
- Page last reviewed: October 27, 2016
- Page last updated: October 27, 2016
- Content source: Division of HIV/AIDS Prevention, National Center for HIV/AIDS, Viral Hepatitis, STD, and TB Prevention, Centers for Disease Control and Prevention