

 ShareCompartir
Statistics and Surveillance
Surveillance
Viral Hepatitis Surveillance – United States, 2015
Viral Hepatitis Surveillance – United States, 2014
Viral Hepatitis Surveillance – United States, 2013
Viral Hepatitis Surveillance – United States, 2012
Viral Hepatitis Surveillance – United States, 2011
Viral Hepatitis Surveillance – United States, 2010
Viral Hepatitis Surveillance – United States, 2009
Surveillance Data for Acute Viral Hepatitis – United States, 2008
Surveillance for Acute Viral Hepatitis — United States, 2007 [PDF – 32 pages]
MMWR 2009;58(SS-3)
Health Care Related Outbreaks Reported to CDC
Hepatitis B and C Outbreaks Related to Health Care Reported to CDC
Surveillance Guidelines and Forms
Guidelines for Viral Hepatitis Surveillance and Case Management
Viral Hepatitis Surveillance Report Form [PDF – 7 pages]
This form (finalized in September 2013) is to serve as a guide for surveillance and is based on CSTE recommendations.
Hepatitis Case Record Form [PDF – 2 pages]
National Electronic Telecommunications System for Surveillance
Disease Burden from Viral Hepatitis A, B, and C in the United States
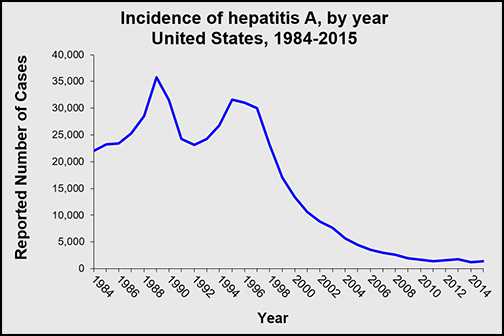
Hepatitis A
|
Reported Acute (New) Cases of
Hepatitis A Virus (HAV) |
|||||||||
|---|---|---|---|---|---|---|---|---|---|
|
2005
|
2006
|
2007
|
2008
|
2009
|
2010
|
2011
|
2012
|
2013
|
2014
|
|
4,488
|
3,579
|
2,979
|
2,585
|
1,987
|
1,670
|
1,398
|
1,562
|
1,781
|
1,239
|
|
Estimated Actual New Cases of
HAV (range) |
|||
|---|---|---|---|
| 2011 (estimated) * | 2012 (estimated) * | 2013 (estimated) * | 2014 (estimated) * |
|
2,700 (1,900- 3,100)
|
3,000 (2,200- 3,500)
|
3,500 (2,500- 3,900)
|
2,500 (1,700- 2,800)
|
* Actual acute cases estimated to be 1.96 times the number of reported cases in any year
|
Est. No. of Chronic Cases
In the United States |
|---|
|
No chronic infections
|
|
No. of Death Certificates listing
HAV as a Cause of Death |
||||
|---|---|---|---|---|
|
2010
|
2011
|
2012
|
2013
|
2014*
|
|
95
|
69
|
77
|
80
|
76
|
* Underlying or contributing cause of death in most recent year available (2014)
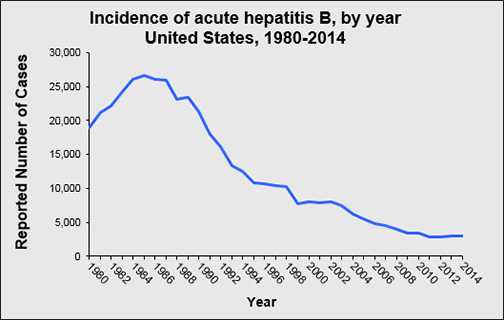
Hepatitis B
|
Reported Acute (New) Cases of
Hepatitis B Virus (HBV) |
|||||||||
|---|---|---|---|---|---|---|---|---|---|
|
2005
|
2006
|
2007
|
2008
|
2009
|
2010
|
2011
|
2012
|
2013
|
2014
|
|
5,494
|
4,758
|
4,519
|
4,033
|
3,374
|
3,350
|
2,890
|
2,895
|
3,050
|
2,953
|
|
Estimated Actual New Cases of
HBV (range) |
|||
|---|---|---|---|
|
2011 (estimated)*
|
2012 (estimated)*
|
2013 (estimated)*
|
2014 (estimated)*
|
|
18,800 (10,800-46,100)
|
18,800 (10,800-46,100)
|
19,800 (11,300-48,500)
|
19,200 (11,000-47,100)
|
* Actual acute cases estimated to be 6.48 times the number of reported cases in any year
|
Est. No. of Chronic Cases
In the United States |
|---|
|
850,000- 2.2 million
|
|
No. of Death Certificates listing
HBV as a Cause of Death |
||||
|---|---|---|---|---|
|
2010
|
2011
|
2012
|
2013
|
2014*
|
|
1,792
|
1,804
|
1,771
|
1,873
|
1,843
|
* Underlying or contributing cause of death in most recent year available (2014)
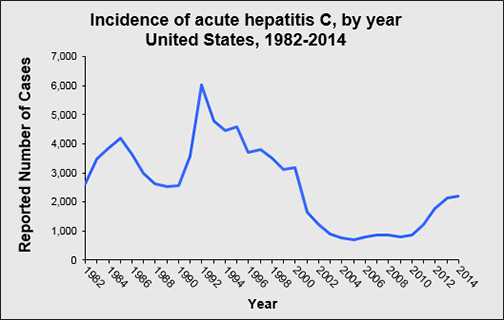
Hepatitis C
|
Reported Acute (New) Cases of
Hepatitis C Virus (HCV) |
|||||||||
|---|---|---|---|---|---|---|---|---|---|
|
2005
|
2006
|
2007
|
2008
|
2009
|
2010
|
2011
|
2012
|
2013
|
2014
|
|
694
|
802
|
849
|
878
|
781
|
853
|
1,230
|
1,778
|
2,138
|
2,194
|
|
Estimated Actual New Cases of
HCV (range) |
|||
|---|---|---|---|
|
2011 (estimated)*
|
2012 (estimated)*
|
2013 (estimated)*
|
2014 (estimated)*
|
|
16,500 (7,200-43,400)
|
24,700 (19,600-84,400)
|
29,700 (23,500-101,400)
|
30,500 (24,200-104,200)
|
* Actual acute cases estimated to be 13.9 times the number of reported cases in any year
|
Est. No. of Chronic Cases
In the United States |
|---|
|
2.7- 3.9 million
|
|
No. of Death Certificates listing
HCV as a Cause of Death |
||||
|---|---|---|---|---|
|
2010
|
2011
|
2012
|
2013*
|
2014*
|
|
16,627†
|
17,721†
|
18,650†
|
19,368†
|
19,659†
|
* Underlying or contributing cause of death in most recent year available (2014)
†Current information indicates these represent a fraction of deaths attributable in whole or in part to chronic hepatitis C
- Page last reviewed: May 11, 2017
- Page last updated: May 11, 2017
- Content source: