

Surveillance for Viral Hepatitis – United States, 2015
 ShareCompartir
Entire report in a printable format [PDF – 2MB – 73 pages]
Contents
Summary of Trends in Viral Hepatitis – United States, 2015
Investigation of Healthcare-associated Outbreak Cases
Table 1.1 Hepatitis C Outbreaks by Setting ― United States, 2015
Hepatitis A virus
Index-HepA
|
PAGE
|
DESCRIPTION
|
|---|---|
| Table 2.1 | Reported cases of hepatitis A, nationally and by state or jurisdiction― United States, 2011-2015 |
| Table 2.2 | Select Clinical Characteristics of Hepatitis A Cases Reported in the United States, 2015 |
| Table 2.3 | Number and rate of hepatitis A-related deaths, by demographic characteristics and year — United States, 2011–2015 |
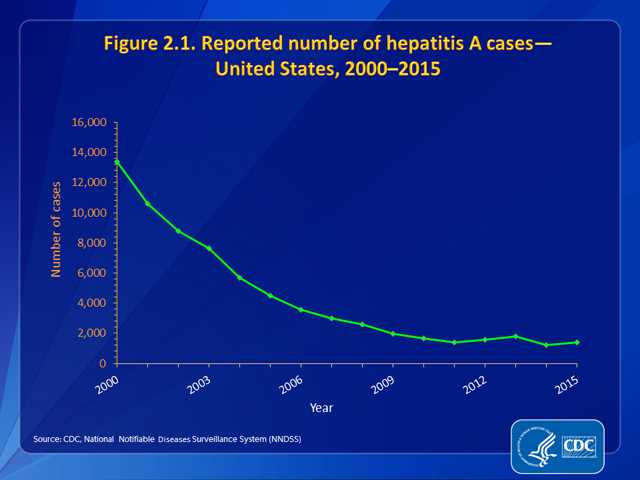
| Figure 2.1 | Reported number of hepatitis A — United States, 2000–2015 |
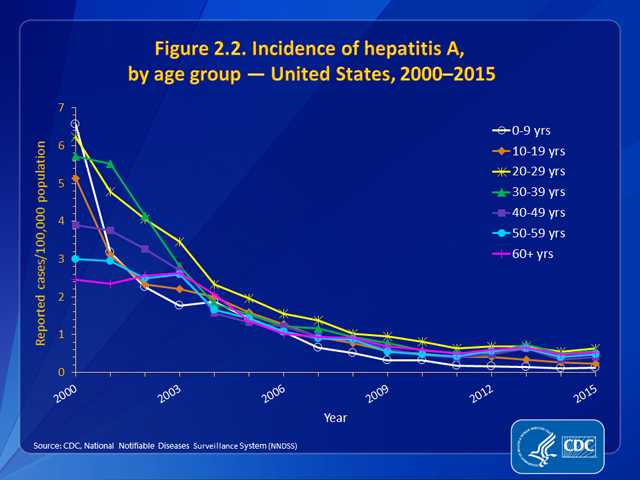
| Figure 2.2 | Incidence of hepatitis A, by age group — United States, 2000–2015 |
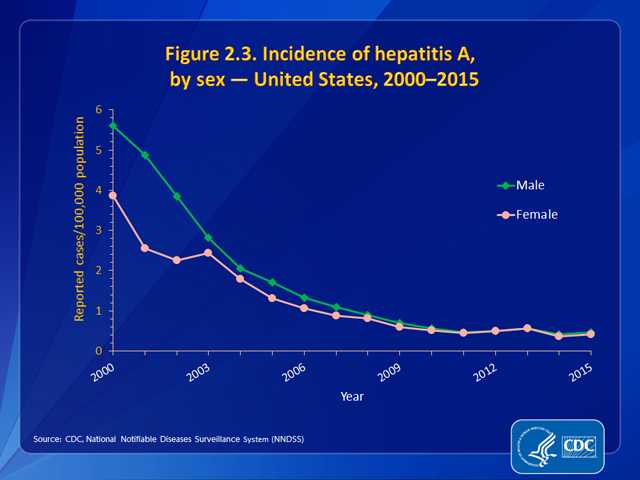
| Figure 2.3 | Incidence of hepatitis A, by sex — United States, 2000–2015 |
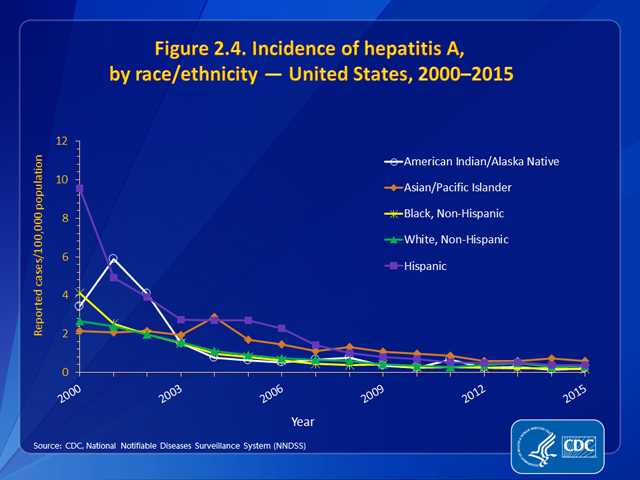
| Figure 2.4 | Incidence of hepatitis A, by race/ethnicity — United States, 2000–2015 |
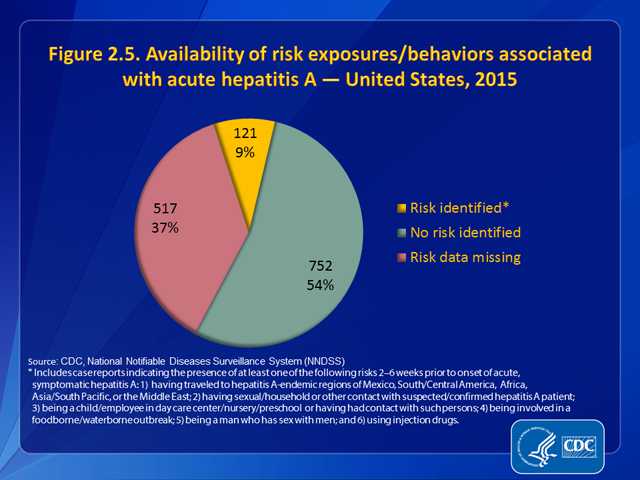
| Figure 2.5 | Availability of information on risk exposures/behaviors associated with hepatitis A — United States, 2015 |
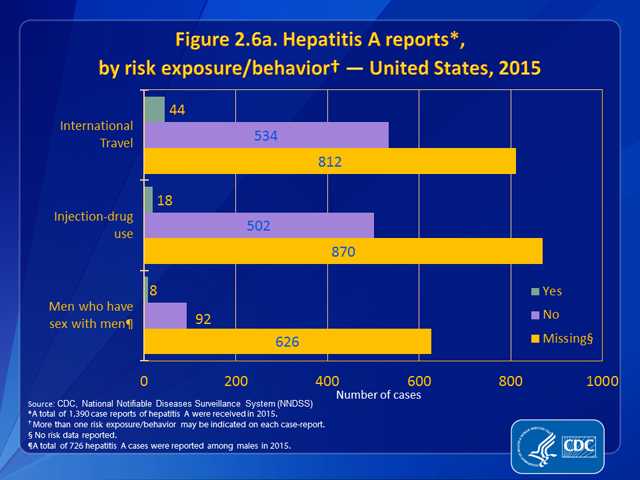
| Figure 2.6a | Hepatitis A reports, by risk exposure/behavior — United States, 2015 |
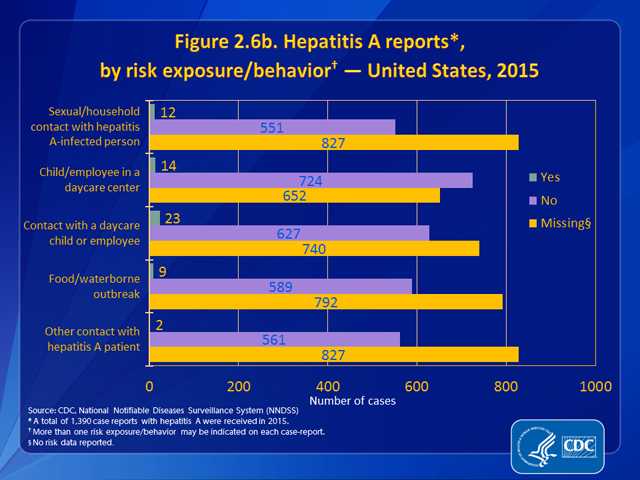
| Figure 2.6b | Hepatitis A reports, by risk exposure/behavior — United States, 2015 |
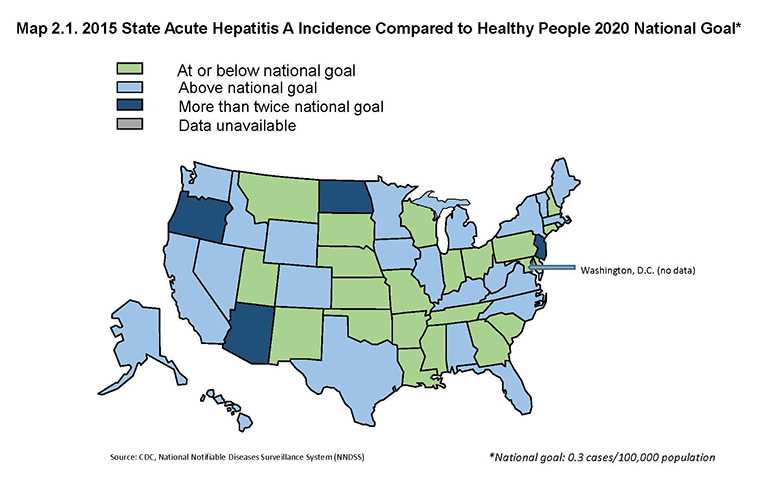
| Map 2.1 | 2015 State Acute Hepatitis A Incidence Compared to Healthy People 2020 National Goal |
Hepatitis A virus
Table 2.1. Reported cases of hepatitis A, nationally and by state or jurisdiction ― United States, 2011–2015
| State |
2011
|
2012
|
2013
|
2014
|
2015
|
|||||
|---|---|---|---|---|---|---|---|---|---|---|
| No. | Rate* | No. | Rate* | No. | Rate* | No. | Rate* | No. | Rate* | |
| Alabama | 8 | 0.2 | 19 | 0.4 | 10 | 0.2 | 15 | 0.3 | 23 | 0.5 |
| Alaska | 4 | 0.6 | 1 | 0.1 | 1 | 0.1 | 1 | 0.1 | 4 | 0.5 |
| Arizona | 77 | 1.2 | 93 | 1.4 | 66 | 1.0 | 29 | 0.4 | 54 | 0.8 |
| Arkansas | 3 | 0.1 | 8 | 0.3 | 9 | 0.3 | 2 | 0.1 | 10 | 0.3 |
| California | 186 | 0.5 | 209 | 0.5 | 255 | 0.7 | 142 | 0.4 | 179 | 0.5 |
| Colorado | 21 | 0.4 | 28 | 0.5 | 51 | 1.0 | 23 | 0.4 | 25 | 0.5 |
| Connecticut | 18 | 0.5 | 23 | 0.6 | 19 | 0.5 | 23 | 0.6 | 9 | 0.3 |
| Delaware | 2 | 0.2 | 9 | 1.0 | 4 | 0.4 | 1 | 0.1 | 2 | 0.2 |
| District of Columbia | U | U | U | U | U | U | U | U | U | U |
| Florida | 87 | 0.5 | 87 | 0.5 | 115 | 0.6 | 90 | 0.5 | 108 | 0.5 |
| Georgia | 27 | 0.3 | 46 | 0.5 | 36 | 0.4 | 24 | 0.2 | 30 | 0.3 |
| Hawaii | 8 | 0.6 | 5 | 0.4 | 16 | 1.1 | 5 | 0.4 | 6 | 0.4 |
| Idaho | 6 | 0.4 | 11 | 0.7 | 8 | 0.5 | 7 | 0.4 | 9 | 0.5 |
| Illinois | 73 | 0.6 | 67 | 0.5 | 79 | 0.6 | 82 | 0.6 | 57 | 0.4 |
| Indiana | 24 | 0.4 | 11 | 0.2 | 32 | 0.5 | 20 | 0.3 | 19 | 0.3 |
| Iowa | 8 | 0.3 | 7 | 0.2 | 17 | 0.6 | 12 | 0.4 | 16 | 0.5 |
| Kansas | 4 | 0.1 | 15 | 0.5 | 11 | 0.4 | 7 | 0.2 | 7 | 0.2 |
| Kentucky | 10 | 0.2 | 25 | 0.6 | 24 | 0.5 | 19 | 0.4 | 16 | 0.4 |
| Louisiana | 5 | 0.1 | 7 | 0.2 | 14 | 0.3 | 5 | 0.1 | 5 | 0.1 |
| Maine | 6 | 0.5 | 9 | 0.7 | 10 | 0.8 | 8 | 0.6 | 8 | 0.6 |
| Maryland | 26 | 0.4 | 28 | 0.5 | 29 | 0.5 | 27 | 0.5 | 19 | 0.3 |
| Massachusetts | 39 | 0.6 | 40 | 0.6 | 43 | 0.6 | 43 | 0.6 | 34 | 0.5 |
| Michigan | 70 | 0.7 | 100 | 1.0 | 83 | 0.8 | 45 | 0.5 | 51 | 0.5 |
| Minnesota | 27 | 0.5 | 29 | 0.5 | 32 | 0.6 | 19 | 0.3 | 21 | 0.4 |
| Mississippi | 7 | 0.2 | 11 | 0.4 | 5 | 0.2 | 3 | 0.1 | 2 | 0.1 |
| Missouri | 13 | 0.2 | 20 | 0.3 | 8 | 0.1 | 20 | 0.3 | 9 | 0.1 |
| Montana | 3 | 0.3 | 6 | 0.6 | 6 | 0.6 | 5 | 0.5 | 2 | 0.2 |
| Nebraska | 5 | 0.3 | 16 | 0.9 | 13 | 0.7 | 9 | 0.5 | 6 | 0.3 |
| Nevada | 5 | 0.2 | 10 | 0.4 | 19 | 0.7 | 5 | 0.2 | 11 | 0.4 |
| New Hampshire | 0 | 0.0 | 6 | 0.5 | 9 | 0.7 | 5 | 0.4 | 2 | 0.2 |
| New Jersey | 79 | 0.9 | 60 | 0.7 | 68 | 0.8 | 59 | 0.7 | 59 | 0.7 |
| New Mexico | 7 | 0.3 | 10 | 0.5 | 20 | 1.0 | 8 | 0.4 | 6 | 0.3 |
| New York | 113 | 0.6 | 111 | 0.6 | 167 | 0.8 | 84 | 0.4 | 123 | 0.6 |
| North Carolina | 31 | 0.3 | 34 | 0.3 | 46 | 0.5 | 38 | 0.4 | 45 | 0.4 |
| North Dakota | 0 | 0.0 | 2 | 0.3 | 9 | 1.2 | 9 | 1.2 | 5 | 0.7 |
| Ohio | 39 | 0.3 | 36 | 0.3 | 59 | 0.5 | 32 | 0.3 | 36 | 0.3 |
| Oklahoma | 11 | 0.3 | 12 | 0.3 | 14 | 0.4 | 17 | 0.4 | 11 | 0.3 |
| Oregon | 11 | 0.3 | 9 | 0.2 | 29 | 0.7 | 13 | 0.3 | 28 | 0.7 |
| Pennsylvania | 60 | 0.5 | 62 | 0.5 | 53 | 0.4 | 48 | 0.4 | 43 | 0.3 |
| Rhode Island | 8 | 0.8 | 3 | 0.3 | 4 | 0.4 | 8 | 0.8 | 4 | 0.4 |
| South Carolina | 11 | 0.2 | 6 | 0.1 | 14 | 0.3 | 6 | 0.1 | 16 | 0.3 |
| South Dakota | 2 | 0.2 | 0 | 0.0 | 4 | 0.5 | 3 | 0.4 | 2 | 0.2 |
| Tennessee | 23 | 0.4 | 23 | 0.4 | 20 | 0.3 | 12 | 0.2 | 14 | 0.2 |
| Texas | 138 | 0.5 | 134 | 0.5 | 109 | 0.4 | 124 | 0.5 | 147 | 0.5 |
| Utah | 8 | 0.3 | 4 | 0.1 | 12 | 0.4 | 8 | 0.3 | 8 | 0.3 |
| Vermont | 6 | 1.0 | 2 | 0.3 | 7 | 1.1 | 1 | 0.2 | 3 | 0.5 |
| Virginia | 30 | 0.4 | 49 | 0.6 | 36 | 0.4 | 27 | 0.3 | 50 | 0.6 |
| Washington | 31 | 0.5 | 29 | 0.4 | 45 | 0.6 | 26 | 0.4 | 26 | 0.4 |
| West Virginia | 8 | 0.4 | 8 | 0.4 | 4 | 0.2 | 12 | 0.6 | 8 | 0.4 |
| Wisconsin | 8 | 0.1 | 21 | 0.4 | 37 | 0.6 | 7 | 0.1 | 9 | 0.2 |
| Wyoming | 2 | 0.4 | 1 | 0.2 | 0 | 0.0 | 1 | 0.2 | 3 | 0.5 |
| U.S. | 1398 | 0.4 | 1562 | 0.5 | 1781 | 0.6 | 1239 | 0.4 | 1390 | 0.4 |
Source: CDC, National Notifiable Diseases Surveillance System.
*Rate per 100,000 population.
U=No data available for reporting.
Table 2.2. Select Clinical Characteristics of Hepatitis A Cases* Reported in the United States, 2015
| Clinical characteristic |
Availability of valid data† for clinical characteristic
|
Cases with clinical characteristic§
|
||
|---|---|---|---|---|
|
No.
|
%
|
No.
|
%
|
|
|
Jaundice
|
865
|
62.2
|
541
|
62.5
|
|
Hospitalized for hepatitis A
|
870
|
62.6
|
411
|
47.2
|
|
Died from hepatitis A
|
801
|
57.6
|
8
|
1
|
Source: CDC, National Notifiable Diseases Surveillance System.
*A total of 1,390 hepatitis A cases were reported during 2015.
†Case reports for which questions regarding clinical characteristics were answered with “yes” or “no.” Reports with any other response were excluded.
§Numbers and percentages represent only those case reports for which data regarding clinical characteristics were available; numbers likely are underestimates.
Table 2.3. Number and rate* of hepatitis A-related deaths†, by demographic characteristics and year — United States, 2011–2015
| Demographic characteristic |
2011
|
2012§
|
2013
|
2014
|
2015
|
||||||
|---|---|---|---|---|---|---|---|---|---|---|---|
| No. | Rate | No. | Rate | No. | Rate | No. | Rate | No. | Rate | ||
| Age Group (years) |
0–34 | 0 | 0.00 | 2 | 0.00 | 2 | 0.00 | 0 | 0.00 | 1 | 0.00 |
| 35–44 | 1 | 0.00 | 5 | 0.01 | 2 | 0.00 | 4 | 0.01 | 4 | 0.01 | |
| 45–54 | 11 | 0.02 | 12 | 0.03 | 13 | 0.03 | 7 | 0.02 | 6 | 0.01 | |
| 55–64 | 16 | 0.04 | 23 | 0.06 | 30 | 0.08 | 28 | 0.07 | 19 | 0.05 | |
| 65–74 | 12 | 0.05 | 17 | 0.07 | 19 | 0.08 | 19 | 0.07 | 16 | 0.06 | |
| ≥75 | 29 | 0.15 | 18 | 0.09 | 14 | 0.07 | 18 | 0.09 | 21 | 0.10 | |
| Race/ ethnicity§ |
White NH (non-Hispanic) | 44 | 0.02 | 51 | 0.02 | 63 | 0.02 | 51 | 0.02 | 45 | 0.02 |
| Black NH | 10 | 0.03 | 8 | 0.02 | 6 | 0.01 | 11 | 0.03 | 7 | 0.02 | |
| Hispanic | 6 | 0.02 | 8 | 0.02 | 8 | 0.02 | 10 | 0.02 | 10 | 0.03 | |
| Asian/Pacific Islander | 8 | 0.06 | 7 | 0.05 | 3 | 0.02 | 2 | 0.01 | 4 | 0.02 | |
| American Indian/Alaska Native | 1 | 0.04 | 2 | 0.08 | 0 | 0.00 | 2 | 0.10 | 1 | 0.04 | |
| Sex | Male | 37 | 0.02 | 46 | 0.03 | 50 | 0.03 | 42 | 0.02 | 38 | 0.02 |
| Female | 32 | 0.02 | 31 | 0.02 | 30 | 0.01 | 34 | 0.02 | 29 | 0.02 | |
| Overall | 69 | 0.02 | 77 | 0.02 | 80 | 0.02 | 76 | 0.02 | 67 | 0.02 | |
Source: CDC, National Vital Statistics System.
*Rates for race, sex, and overall total are age-adjusted per 100,000 U.S. standard population in 2000.
†Cause of death is defined as the underlying cause of death or one of the multiple causes of death and is based on the International Classification of Diseases, 10th Revision (ICD-10) codes B15 (hepatitis A).
§One death in 2012 is not represented under the race/ethnicity category due to missing data.
Downloads of this slide: PDF PowerPoint
Downloads of this slide: PDF PowerPoint
Downloads of this slide: PDF PowerPoint
Downloads of this slide: PDF PowerPoint
Downloads of this slide: PDF PowerPoint
Downloads of this slide: PDF PowerPoint
Downloads of this slide: PDF PowerPoint
Downloads of this slide: PDF PowerPoint
All seven figure slides in PowerPoint [PPT – 827 KB]
Hepatitis B virus
Index-HepB
|
PAGE
|
DESCRIPTION
|
|---|---|
| Table 3.1 | Reported cases of acute hepatitis B, nationally and by state or jurisdiction ― United States, 2011–2015 |
| Table 3.2 | Select Clinical Characteristics of Acute Hepatitis B Cases Reported in the United States, 2015 |
| Table 3.3 | Number of newly reported case reports of confirmed chronic hepatitis B submitted by states or jurisdictions, 2015 |
| Table 3.4 | Reported cases of chronic hepatitis B, by demographic characteristics and laboratory tests — Enhanced Viral Hepatitis Surveillance Sites, 2015 |
| Table 3.5 | Number and rate of hepatitis B-related deaths, by demographic characteristics and year— United States, 2011–2015 |
| Table 3.6 | Number of newly reported case reports of perinatal hepatitis B submitted by states and jurisdictions, 2015 |
| Figure 3.1 | Reported number of acute hepatitis B — United States, 2000–2015 |
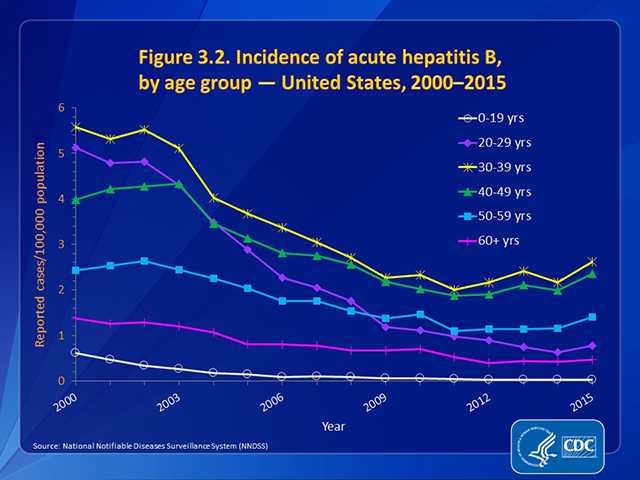
| Figure 3.2 | Incidence of acute hepatitis B, by age group — United States, 2000–2015 |
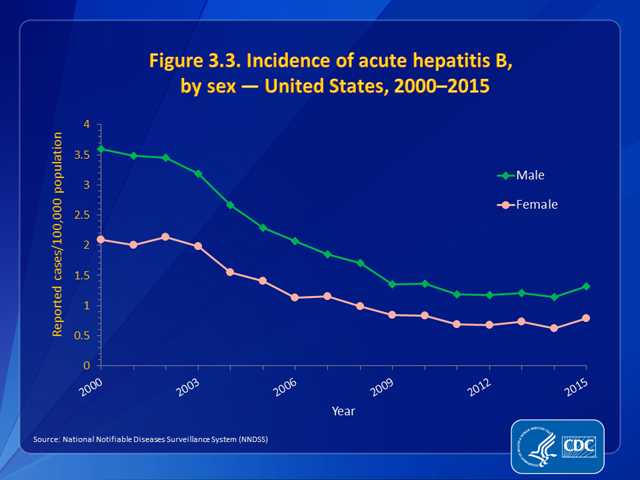
| Figure 3.3 | Incidence of acute hepatitis B, by sex — United States, 2000–2015 |
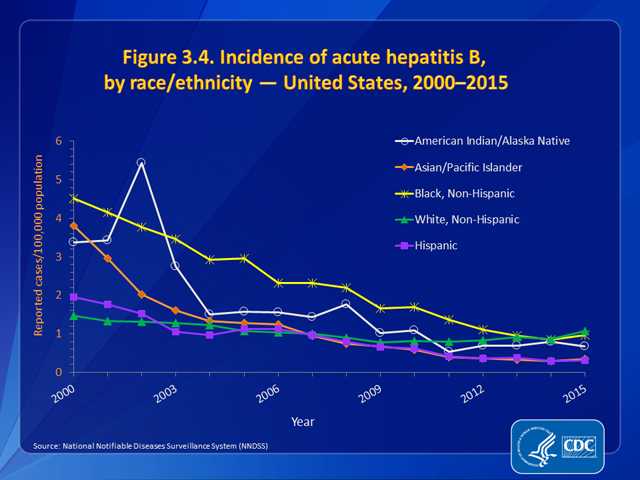
| Figure 3.4 | Incidence of acute hepatitis B, by race/ethnicity — United States, 2000–2015 |
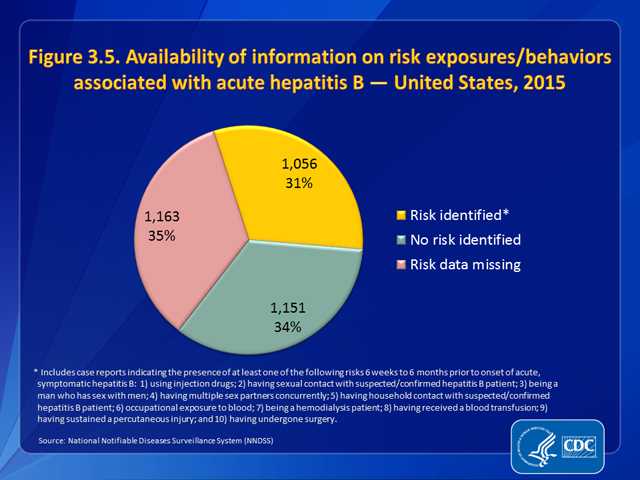
| Figure 3.5 | Availability information on risk exposures/behaviors associated with acute hepatitis B — United States, 2015 |
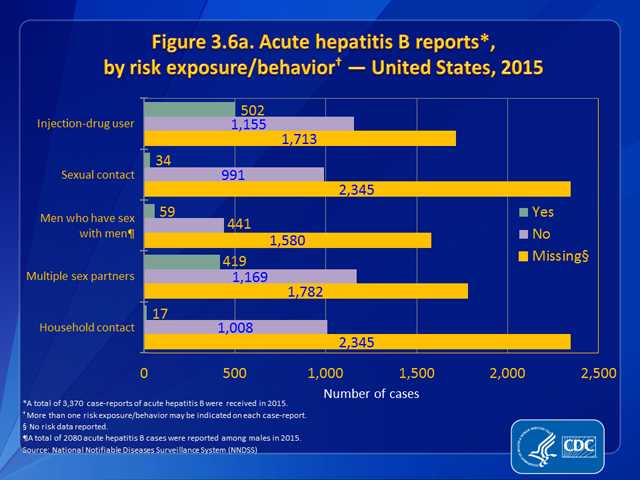
| Figure 3.6a | Acute hepatitis B reports, by risk exposure/behavior — United States, 2015 |
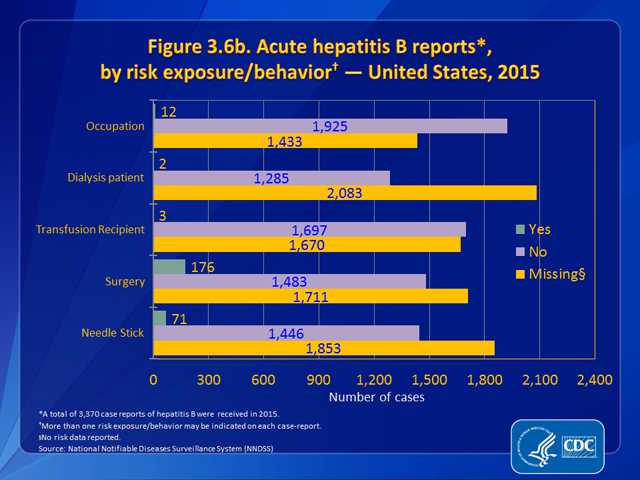
| Figure 3.6b | Acute hepatitis B reports, by risk exposure/behavior — United States, 2015 |
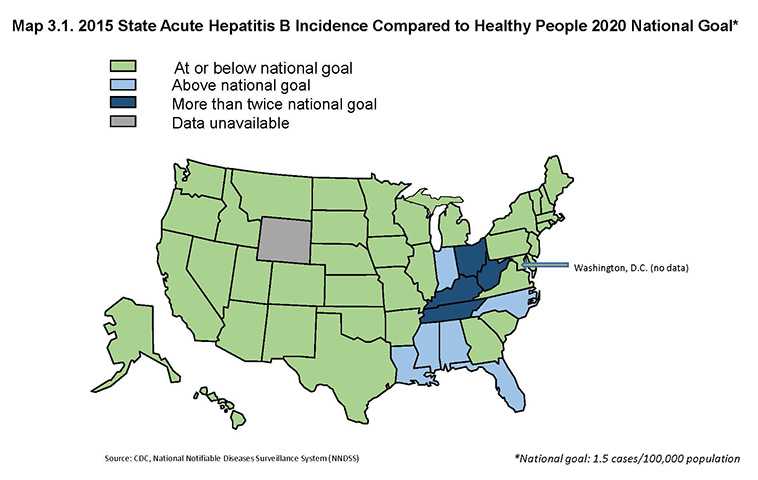
| Map 3.1 | 2015 State Acute Hepatitis B Incidence Compared to Healthy People 2020 National Goal |
Hepatitis B virus
- Tbl 3.1
- Tbl 3.2
- Tbl 3.3
- Tbl 3.4
- Tbl 3.5
- Tbl 3.6
- Fig 3.1
- Fig 3.2
- Fig 3.3
- Fig 3.4
- Fig 3.5
- Fig 3.6a
- Fig 3.6b
- Map 3.1
Table 3.1. Reported cases of acute hepatitis B, nationally and by state or jurisdiction ― United States, 2011–2015
| State |
2011
|
2012
|
2013
|
2014
|
2015
|
|||||
|---|---|---|---|---|---|---|---|---|---|---|
| No. | Rate* | No. | Rate* | No. | Rate* | No. | Rate* | No. | Rate* | |
| Alabama | 119 | 2.5 | 79 | 1.6 | 90 | 1.9 | 117 | 2.4 | 101 | 2.1 |
| Alaska | 3 | 0.4 | 1 | 0.1 | 1 | 0.1 | 3 | 0.4 | 3 | 0.4 |
| Arizona | 14 | 0.2 | 14 | 0.2 | 28 | 0.4 | 31 | 0.5 | 25 | 0.4 |
| Arkansas | 57 | 1.9 | 74 | 2.5 | 50 | 1.7 | 28 | 0.9 | 36 | 1.2 |
| California | 157 | 0.4 | 136 | 0.4 | 138 | 0.4 | 110 | 0.3 | 160 | 0.4 |
| Colorado | 23 | 0.4 | 24 | 0.5 | 24 | 0.5 | 29 | 0.5 | 28 | 0.5 |
| Connecticut | 19 | 0.5 | 15 | 0.4 | 8 | 0.2 | 9 | 0.3 | 6 | 0.2 |
| Delaware | 13 | 1.4 | 11 | 1.2 | 14 | 1.5 | 8 | 0.9 | 8 | 0.8 |
| District of Columbia | U | U | U | U | U | U | U | U | U | U |
| Florida | 213 | 1.1 | 247 | 1.3 | 323 | 1.7 | 313 | 1.6 | 432 | 2.1 |
| Georgia | 142 | 1.4 | 109 | 1.1 | 104 | 1.0 | 103 | 1.0 | 119 | 1.2 |
| Hawaii | 6 | 0.4 | 5 | 0.4 | 4 | 0.3 | 6 | 0.4 | 14 | 1.0 |
| Idaho | 2 | 0.1 | 5 | 0.3 | 13 | 0.8 | 6 | 0.4 | 8 | 0.5 |
| Illinois | 85 | 0.7 | 86 | 0.7 | 94 | 0.7 | 58 | 0.5 | 55 | 0.4 |
| Indiana | 70 | 1.1 | 90 | 1.4 | 101 | 1.5 | 126 | 1.9 | 133 | 2.0 |
| Iowa | 15 | 0.5 | 13 | 0.4 | 11 | 0.4 | 9 | 0.3 | 16 | 0.5 |
| Kansas | 15 | 0.5 | 9 | 0.3 | 11 | 0.4 | 11 | 0.4 | 19 | 0.7 |
| Kentucky | 151 | 3.5 | 180 | 4.1 | 214 | 4.9 | 164 | 3.7 | 162 | 3.7 |
| Louisiana | 62 | 1.4 | 44 | 1.0 | 82 | 1.8 | 87 | 1.9 | 87 | 1.9 |
| Maine | 8 | 0.6 | 9 | 0.7 | 11 | 0.8 | 12 | 0.9 | 9 | 0.7 |
| Maryland | 62 | 1.1 | 52 | 0.9 | 43 | 0.7 | 40 | 0.7 | 40 | 0.7 |
| Massachusetts | 67 | 1.0 | 75 | 1.1 | 71 | 1.1 | 30 | 0.4 | 25 | 0.4 |
| Michigan | 91 | 0.9 | 81 | 0.8 | 53 | 0.5 | 50 | 0.5 | 56 | 0.6 |
| Minnesota | 20 | 0.4 | 17 | 0.3 | 19 | 0.4 | 16 | 0.3 | 19 | 0.3 |
| Mississippi | 57 | 1.9 | 78 | 2.6 | 55 | 1.8 | 48 | 1.6 | 50 | 1.7 |
| Missouri | 60 | 1.0 | 48 | 0.8 | 61 | 1.0 | 31 | 0.5 | 35 | 0.6 |
| Montana | 0 | 0.0 | 2 | 0.2 | 4 | 0.4 | 0 | 0.0 | 4 | 0.4 |
| Nebraska | 12 | 0.7 | 10 | 0.5 | 9 | 0.5 | 8 | 0.4 | 3 | 0.2 |
| Nevada | 29 | 1.1 | 28 | 1.0 | 29 | 1.0 | 21 | 0.7 | 25 | 0.9 |
| New Hampshire | 3 | 0.2 | 4 | 0.3 | 2 | 0.2 | 4 | 0.3 | 0 | 0.0 |
| New Jersey | 73 | 0.8 | 70 | 0.8 | 65 | 0.7 | 77 | 0.9 | 85 | 0.9 |
| New Mexico | 10 | 0.5 | 3 | 0.1 | 3 | 0.1 | 2 | 0.1 | 2 | 0.1 |
| New York | 134 | 0.7 | 113 | 0.6 | 117 | 0.6 | 95 | 0.5 | 80 | 0.4 |
| North Carolina | 109 | 1.1 | 73 | 0.7 | 75 | 0.8 | 100 | 1.0 | 165 | 1.6 |
| North Dakota | 0 | 0.0 | 0 | 0.0 | 0 | 0.0 | 0 | 0.0 | 2 | 0.3 |
| Ohio | 90 | 0.8 | 178 | 1.5 | 225 | 1.9 | 171 | 1.5 | 409 | 3.5 |
| Oklahoma | 100 | 2.6 | 79 | 2.1 | 40 | 1.0 | 57 | 1.5 | 37 | 0.9 |
| Oregon | 32 | 0.8 | 25 | 0.6 | 32 | 0.8 | 32 | 0.8 | 24 | 0.6 |
| Pennsylvania | 84 | 0.7 | 63 | 0.5 | 43 | 0.3 | 68 | 0.5 | 61 | 0.5 |
| Rhode Island | U | U | U | U | U | U | U | U | U | U |
| South Carolina | 39 | 0.8 | 37 | 0.8 | 58 | 1.2 | 37 | 0.8 | 30 | 0.6 |
| South Dakota | 2 | 0.2 | 2 | 0.2 | 5 | 0.6 | 3 | 0.4 | 2 | 0.2 |
| Tennessee | 192 | 3.0 | 240 | 3.7 | 262 | 4.0 | 232 | 3.5 | 243 | 3.7 |
| Texas | 204 | 0.8 | 170 | 0.7 | 142 | 0.5 | 122 | 0.5 | 159 | 0.6 |
| Utah | 10 | 0.4 | 13 | 0.5 | 5 | 0.2 | 11 | 0.4 | 10 | 0.3 |
| Vermont | 0 | 0.0 | 2 | 0.3 | 2 | 0.3 | 4 | 0.6 | 3 | 0.5 |
| Virginia | 84 | 1.0 | 84 | 1.0 | 72 | 0.9 | 61 | 0.7 | 69 | 0.8 |
| Washington | 35 | 0.5 | 34 | 0.5 | 33 | 0.5 | 44 | 0.6 | 34 | 0.5 |
| West Virginia | 113 | 6.1 | 141 | 7.6 | 195 | 10.5 | 186 | 10.1 | 272 | 14.7 |
| Wisconsin | 17 | 0.3 | 22 | 0.4 | 9 | 0.2 | 11 | 0.2 | 5 | 0.1 |
| Wyoming | 0 | 0.0 | 0 | 0.0 | U | U | U | U | U | U |
| Total | 2903 | 0.9 | 2895 | 0.9 | 3050 | 1.0 | 2791 | 0.9 | 3370 | 1.1 |
Source: CDC, National Notifiable Diseases Surveillance System.
*Rate per 100,000 population.
U=No data available for reporting.
Table 3.2. Select Clinical Characteristics of Acute Hepatitis B Cases* Reported in the United States, 2015
| Clinical characteristic |
Availability of valid data† for clinical characteristic
|
Cases with clinical characteristic§
|
||
|---|---|---|---|---|
|
No.
|
%
|
No.
|
%
|
|
|
Jaundice
|
2,526 | 75.0 | 1,891 | 74.9 |
|
Hospitalized for hepatitis B
|
2,515 | 74.6 | 1,502 | 59.7 |
|
Died from hepatitis B
|
2,311 | 68.6 | 20 | 0.9 |
Source: CDC, National Notifiable Diseases Surveillance System.
*A total of 3,370 hepatitis B cases were reported during 2015.
†Case reports for which questions regarding clinical characteristics were answered with “yes” or “no.” Reports with any other response were excluded.
§Numbers and percentages represent only those case reports for which data regarding clinical characteristics were available; numbers likely are underestimates.
Table 3.3. Number of newly reported case* reports† of confirmed chronic hepatitis B submitted by states or jurisdictions, 2015
| State/Jurisdiction | No. chronic hepatitis B case reports submitted† |
|---|---|
| Alabama | N |
| Alaska | N |
| Arizona | 133 |
| Arkansas | N |
| California | 1,008 |
| Colorado | 163 |
| Connecticut | 38 |
| Delaware | 122 |
| District of Columbia | U |
| Florida | 1,423 |
| Georgia | 1,867 |
| Hawaii | N |
| Idaho | 51 |
| Illinois | 440 |
| Indiana | 68 |
| Iowa | 39 |
| Kansas | 130 |
| Kentucky | 16 |
| Louisiana | 201 |
| Maine | 51 |
| Maryland | 566 |
| Massachusetts | 284 |
| Michigan | 350 |
| Minnesota | 186 |
| Mississippi | N |
| Missouri | 521 |
| Montana | 31 |
| Nebraska | 93 |
| Nevada | N |
| New Hampshire | N |
| New Jersey | 273 |
| New Mexico | 41 |
| New York | 2,315 |
| North Carolina | 507 |
| North Dakota | 53 |
| Ohio | 890 |
| Oklahoma | 84 |
| Oregon | 138 |
| Pennsylvania | 857 |
| Rhode Island | U |
| South Carolina | 156 |
| South Dakota | 23 |
| Tennessee | 253 |
| Texas | N |
| Utah | 64 |
| Vermont | 39 |
| Virginia | 556 |
| Washington | 119 |
| West Virginia | 225 |
| Wisconsin | N |
| Wyoming | 42 |
| Total | 14,416 |
Source: CDC, National Notifiable Diseases Surveillance System.
*For case-definition, see https://wwwn.cdc.gov/nndss/conditions/hepatitis-b-chronic/case-definition/2012/
†Reports may not reflect unique cases.
§ Cases reported by California through NNDSS were all from San Francisco County. The number of cases in this table and table 3.4 differ because NNDSS and CDC’s Secure Access Management System (SAMS)
N= Not Reportable, chronic hepatitis B infection is not reportable in the listed state.
U=No data available for reporting
Table 3.4. Reported cases of chronic hepatitis B, by demographic characteristics and laboratory tests — Enhanced Viral Hepatitis Surveillance Sites, 2015
| Category | FL* No. % |
MA No. % |
MI No. % |
NYS† No. % |
Phil No. % |
SF No. % |
WA No. % |
Total No. % |
|---|---|---|---|---|---|---|---|---|
| Sex | ||||||||
| Female | 641 | 222 | 167 | 334 | 47 | 501 | 67 | 1979 |
| 44.5% | 47.0% | 46.4% | 43.1% | 39.5% | 47.0% | 44.1% | 45.1% | |
| Male | 798 | 250 | 193 | 440 | 71 | 566 | 83 | 2401 |
| 55.4% | 53.0% | 53.6% | 56.8% | 59.7% | 53.0% | 54.6% | 54.7% | |
| Unknown /missing | 2 | 0 | 0 | 1 | 1 | 0 | 2 | 6 |
| 0.10% | 0.00% | 0.00% | 0.10% | 0.80% | 0.00% | 1.30% | 0.10% | |
| Race/Ethnicity | ||||||||
| American Indian/ Alaska Native, NH¶ | 0 | 8 | 6 | 1 | 1 | 0 | 0 | 16 |
| 0.0% | 1.7% | 1.7% | 0.1% | 0.8% | 0.0% | 0.0% | 0.4% | |
| Asian/Pacific Islander, NH | 81 | 159 | 90 | 265 | 45 | 562 | 22 | 1224 |
| 5.6% | 33.7% | 25.0% | 34.2% | 37.8% | 52.7% | 14.5% | 27.9% | |
| Black, NH | 187 | 87 | 46 | 92 | 23 | 13 | 12 | 460 |
| 13.0% | 18.4% | 12.8% | 11.9% | 19.3% | 1.2% | 7.9% | 10.5% | |
| White, NH | 290 | 48 | 108 | 86 | 12 | 26 | 13 | 583 |
| 20.1% | 10.2% | 30.0% | 11.1% | 10.1% | 2.4% | 8.6% | 13.3% | |
| Hispanic | 90 | 15 | 5 | 40 | 5 | 20 | 4 | 179 |
| 6.2% | 3.2% | 1.4% | 5.2% | 4.2% | 1.9% | 2.6% | 4.1% | |
| Other, NH | 47 | 28 | 22 | 33 | 4 | 10 | 5 | 149 |
| 3.3% | 5.9% | 6.1% | 4.3% | 3.4% | 0.9% | 4.2% | 3.4% | |
| Unknown /missing | 746 | 135 | 83 | 258 | 29 | 436 | 96 | 1783 |
| 51.8% | 28.6% | 23.1% | 33.3% | 24.4% | 40.9% | 63.2% | 40.7% | |
| Age group, years | ||||||||
| 0-14 | 9 | 6 | 8 | 4 | 1 | 7 | 3 | 38 |
| 0.6% | 1.3% | 2.2% | 0.5% | 0.8% | 0.7% | 2.0% | 0.9% | |
| 15-24 | 67 | 33 | 26 | 63 | 9 | 43 | 15 | 256 |
| 4.6% | 7.0% | 7.2% | 8.1% | 7.6% | 4.0% | 9.9% | 5.8% | |
| 25-39 | 428 | 209 | 116 | 292 | 41 | 339 | 52 | 1,477 |
| 29.7% | 44.3% | 32.2% | 37.7% | 34.5% | 31.8% | 34.2% | 33.7% | |
| 40-54 | 479 | 126 | 114 | 235 | 43 | 378 | 47 | 1,422 |
| 33.2% | 26.7% | 31.7% | 30.3% | 36.1% | 35.4% | 30.9% | 32.4% | |
| 55+ | 458 | 98 | 96 | 181 | 25 | 303 | 35 | 1,196 |
| 31.8% | 20.8% | 26.7% | 23.4% | 21.0% | 28.4% | 23.0% | 27.3% | |
| Unknown /missing | 0 | 0 | 0 | 0 | 0 | 0 | 0 | 0 |
| 0.0% | 0.0% | 0.0% | 0.0% | 0.0% | 0.0% | 0.0% | 0.0% | |
| Place of Birth | ||||||||
| United States | – | 25 | 85 | 5 | 51 | 14 | – | 180 |
| – | 5.3% | 23.6% | 0.6% | 42.9% | 1.3% | – | 4.1% | |
| Outside United States | – | 180 | 128 | 24 | 62 | 136 | – | 530 |
| – | 38.1% | 35.6% | 3.1% | 52.1% | 12.7% | – | 12.1% | |
| Unknown /missing | 1,441 | 267 | 147 | 746 | 6 | 917 | 152 | 3,676 |
| 100.00% | 56.6% | 40.8% | 96.3% | 5.0% | 85.9% | 100.0% | 83.8% | |
| Hepatitis B laboratory testing** | ||||||||
| HBV surface antigen + | 1,301 | 398 | 270 | 690 | 97 | 943 | 90 | 3,789 |
| 90.3% | 84.3% | 75.0% | 89.0% | 81.5% | 88.4% | 59.2% | 86.4% | |
| [IgM anti-HBc] – | 986 | 84 | 63 | 236 | 0 | 0 | 0 | 1,369 |
| 68.4% | 17.8% | 17.5% | 30.5% | 0.0% | 0.0% | 0.0% | 31.2% | |
| HBV “e” antigen + | 193 | 85 | 12 | 136 | 35 | 106 | 20 | 587 |
| 13.4% | 18.0% | 3.3% | 17.5% | 29.4% | 9.9% | 13.2% | 13.4% | |
| HBV NAT + | 652 | 382 | 13 | 338 | 99 | 941 | 24 | 2,449 |
| 45.2% | 80.9% | 3.6% | 43.6% | 83.2% | 88.2% | 15.8% | 55.8% | |
| Total no. cases | 1,441 | 472 | 360 | 775 | 119 | 1,067 | 152 | 4,386 |
| 2015 Estimated population total†† | 20,271,272 | 6,794,422 | 9,922,576 | 11,245,386 | 1,567,442 | 864,816 | 7,170,351 | 57,836,265 |
| Rate per 100,000 population | 7.1 | 6.9 | 3.6 | 6.9 | 7.6 | 123.4 | 2.1 | 7.6 |
Source: CDC, Enhanced Viral Hepatitis Surveillance Sites.
Abbreviations: FL, Florida, MA, Massachusetts; MI, Michigan; NYS, New York State; Phil, Philadelphia; SF, San Francisco; WA, Washington State
Percentages may not sum to 100% due to rounding.
* Florida DOH only reported cases from the following 10 counties: Alachua, Broward, Hillsborough, Miami-Dade, Orange, Palm Beach, Pinellas, Polk, Sarasota, and Seminole
†New York City was not included in the case count for New York State, therefore cases and population estimates from New York excluded those who resided in New York City
§The denominator used to calculate proportions was the total number of cases reported for each site.
¶NH: Non-Hispanic
**Cases can be reported with more than one laboratory test result.
††Population estimates for the United States: https://www.census.gov/quickfacts/table/PST045216/00
HBV: Hepatitis B Virus; IgM anti-HBc (Anti-Hepatitis B core IgM); NAT: HBV nucleic acid testing.
Table 3.5. Number and rate* of hepatitis B-related deaths†, by demographic characteristics and year – United States, 2011-2015
| Demographic characteristic |
2011
|
2012
|
2013
|
2014
|
2015
|
||||||
|---|---|---|---|---|---|---|---|---|---|---|---|
| No. | Rate | No. | Rate | No. | Rate | No. | Rate | No. | Rate | ||
| Age Group (years)§ |
0–34 | 41 | 0.03 | 38 | 0.03 | 40 | 0.03 | 35 | 0.02 | 31 | 0.02 |
| 35–44 | 143 | 0.35 | 123 | 0.30 | 146 | 0.36 | 126 | 0.31 | 120 | .3 | |
| 45–54 | 421 | 0.94 | 428 | 0.97 | 389 | 0.89 | 384 | 0.88 | 332 | 0.77 | |
| 55–64 | 645 | 1.69 | 639 | 1.66 | 704 | 1.79 | 684 | 1.71 | 611 | 1.49 | |
| 65–74 | 285 | 1.27 | 314 | 1.31 | 343 | 1.36 | 358 | 1.36 | 384 | 1.39 | |
| ≥75 | 269 | 1.42 | 229 | 1.20 | 251 | 1.29 | 256 | 1.29 | 236 | 1.17 | |
| Race / ethnicity¶ | White NH (non-Hispanic) | 832 | 0.32 | 818 | 0.31 | 868 | 0.33 | 853 | 0.32 | 809 | 0.3 |
| Black NH | 373 | 0.98 | 322 | 0.81 | 384 | 0.98 | 330 | 0.80 | 320 | 0.78 | |
| Hispanic | 161 | 0.48 | 139 | 0.39 | 149 | 0.39 | 155 | 0.38 | 134 | 0.32 | |
| Asian / Pacific Islander | 422 | 2.72 | 469 | 2.93 | 451 | 2.64 | 478 | 2.71 | 420 | 2.24 | |
| American Indian / Alaska Native | 9 | 0.39 | 18 | 0.74 | 14 | 0.55 | 11 | 0.43 | 16 | 0.58 | |
| Sex | Male | 1,321 | 0.80 | 1,272 | 0.75 | 1,375 | 0.79 | 1,307 | 0.74 | 1277 | 0.72 |
| Female | 483 | 0.26 | 499 | 0.27 | 498 | 0.26 | 536 | 0.27 | 438 | 0.22 | |
| Overall | 1,804 | 0.52 | 1,771 | 0.50 | 1,873 | 0.52 | 1,843 | 0.50 | 1,715 | 0.45 | |
Source: CDC, National Vital Statistics System.
*Rates for race, sex, and overall total are age-adjusted per 100,000 U.S. standard population in 2000.
†Cause of death is defined as the underlying cause of death or one of the multiple causes of death and is based on the International Classification of Diseases, 10th Revision (ICD-10) codes B16, B17.0, B18.0, B18.1 (hepatitis B).
§ One death in 2015 is not represented under the age group category due to missing data
¶ Seven deaths in 2011, five deaths in 2012, seven deaths in 2013, 16 deaths in 2014, and 16 deaths in 2015 are not represented under the race/ethnicity category due to missing data.
Table 3.6. Number of newly reported case* reports† of perinatal hepatitis B§ submitted by states and jurisdictions, 2015
| State/Jurisdiction | No. Perinatal hepatitis B case reports† submitted |
|---|---|
| Alabama | 1 |
| California | 11 |
| Colorado | 1 |
| Connecticut | 1 |
| Georgia | 2 |
| Hawaii | 1 |
| Massachusetts | 1 |
| Minnesota | 3 |
| Nebraska | 1 |
| Nevada | 1 |
| New York | 4 |
| North Carolina | 1 |
| Oregon | 2 |
| Texas | 1 |
| Virginia | 1 |
| Washington | 1 |
| West Virginia | 2 |
| Wisconsin | 2 |
| Total | 37 |
Source: CDC, National Notifiable Diseases Surveillance System.
*For case-definition, see https://wwwn.cdc.gov/nndss/conditions/hepatitis-b-perinatal-virus-infection/case-definition/1995/
†Reports may not reflect unique cases.
§ Perinatal hepatitis B is not reportable disease in ALL jurisdictions

Downloads of this slide: PDF PowerPoint
Downloads of this slide: PDF PowerPoint
Downloads of this slide: PDF PowerPoint
Downloads of this slide: PDF PowerPoint
Downloads of this slide: PDF PowerPoint
Downloads of this slide: PDF PowerPoint
Downloads of this slide: PDF PowerPoint
Downloads of this slide: PDF PowerPoint
All seven figure slides in PowerPoint [PPT – 374 KB]
Hepatitis C virus
Index-HepC
|
PAGE
|
DESCRIPTION
|
|---|---|
| Table 4.1 | Reported cases of acute hepatitis C, nationally and by state and jurisdiction ―United States, 2011-2015 |
| Table 4.2 | Select Clinical Characteristics of Acute Hepatitis C Cases Reported in the United States, 2015 |
| Table 4.3 | Number of newly reported case reports of confirmed past or present Hepatitis C submitted by states and jurisdictions, 2015 |
| Table 4.4 | Reported cases of past or present hepatitis C, by demographic characteristics and laboratory tests — Enhanced Viral Hepatitis Surveillance Sites, 2015 |
| Table 4.5 | Number and rate of hepatitis C-related deaths†, by demographic characteristic and year — United States, 2011-2015 |
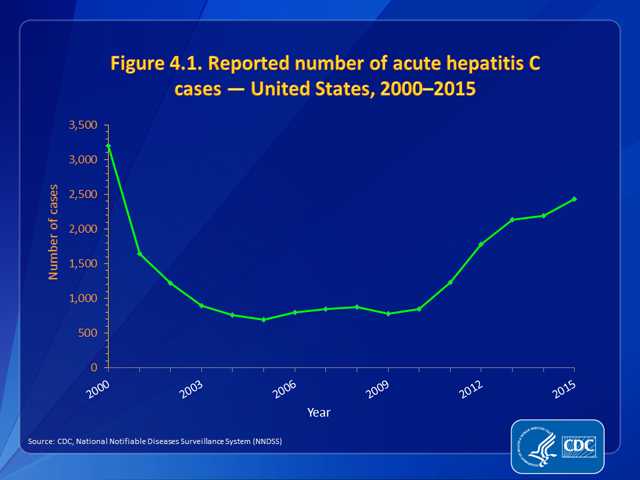
| Figure 4.1 | Reported number of acute hepatitis C — United States, 2000–2015 |
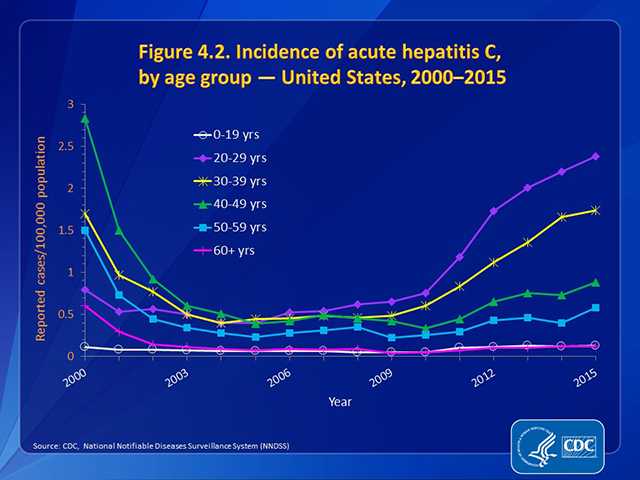
| Figure 4.2 | Incidence of acute hepatitis C, by age group — United States, 2000–2015 |
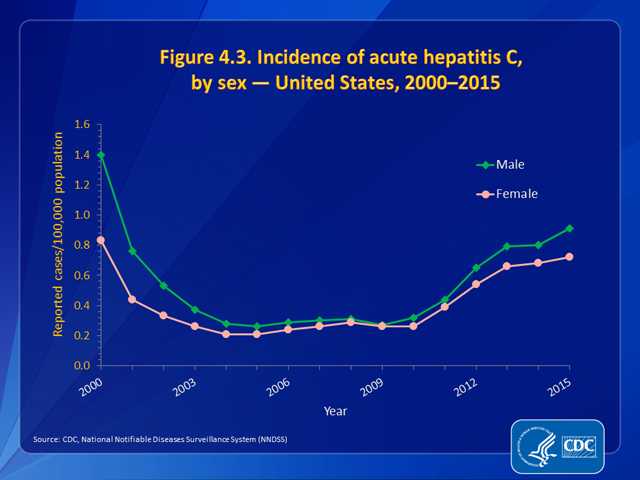
| Figure 4.3 | Incidence of acute hepatitis C, by sex — United States, 2000–2015 |
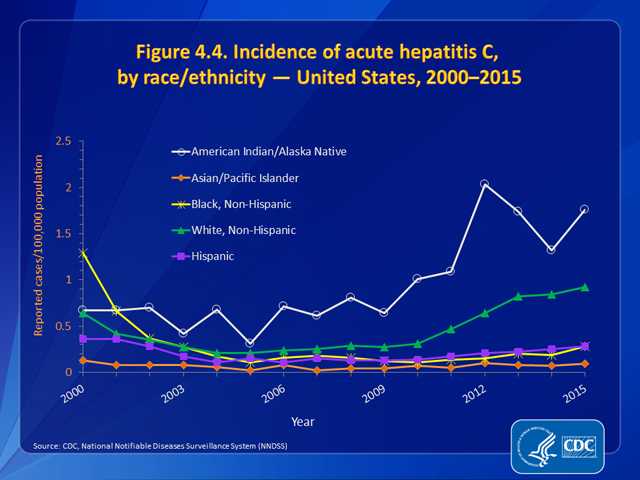
| Figure 4.4 | Incidence of acute hepatitis C, by race/ethnicity — United States, 2000–2015 |
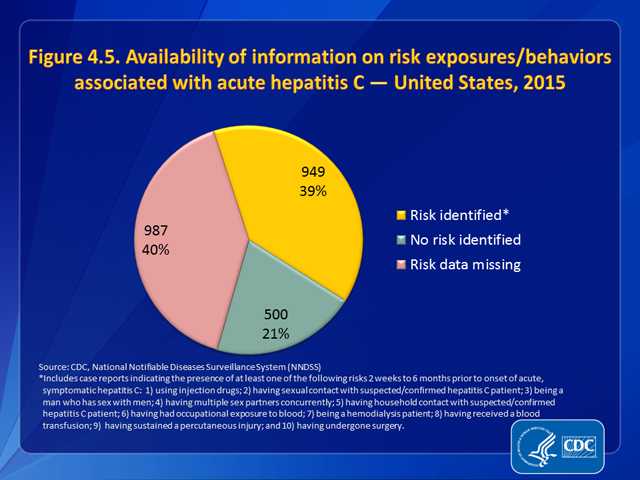
| Figure 4.5 | Availability of information on risk exposures/behaviors associated with acute hepatitis C — United States, 2015 |
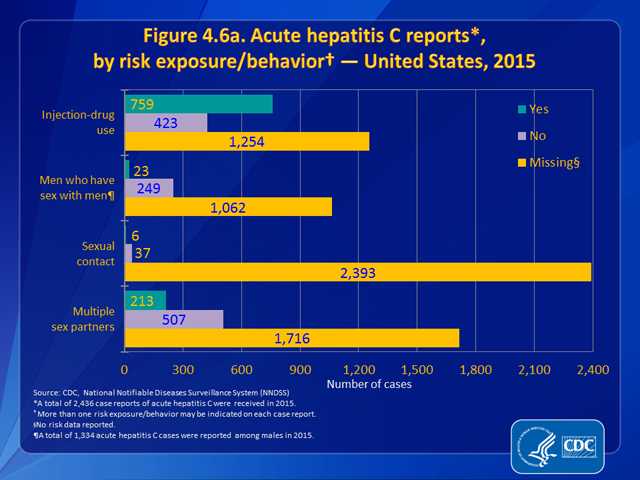
| Figure 4.6a | Acute hepatitis C reports, by risk exposure/behavior — United States, 2015 |
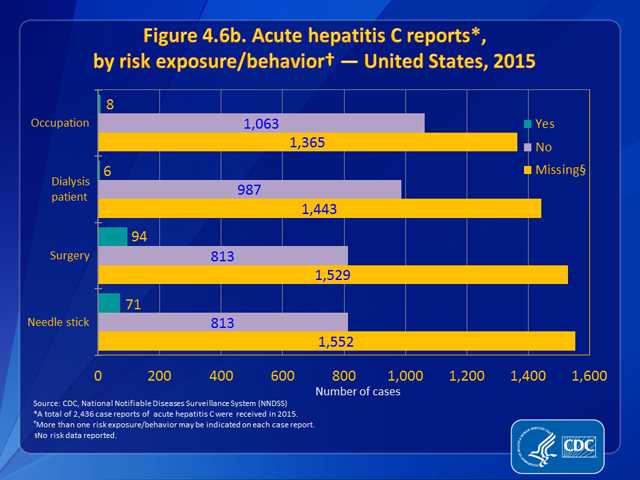
| Figure 4.6b | Acute hepatitis C reports, by risk exposure/behavior — United States, 2015 |
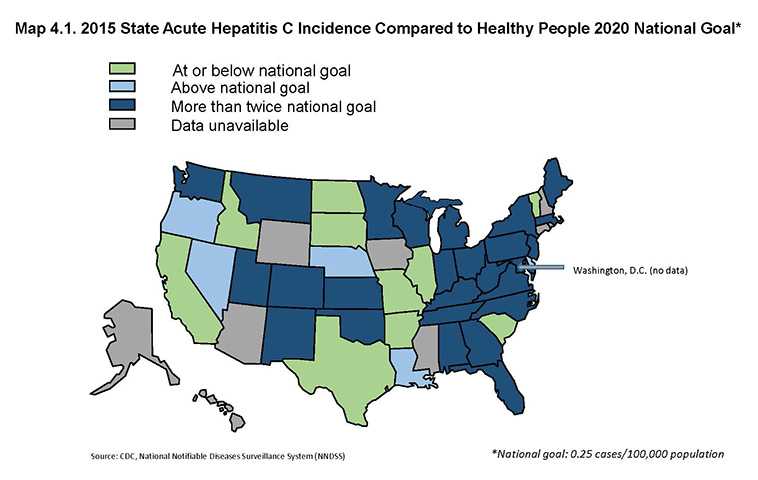
| Map 4.1 | 2015 State Acute Hepatitis C Incidence Compared to Healthy People 2020 National Goal |
Hepatitis C virus
Table 4.1. Reported cases of acute hepatitis C, nationally and by state and jurisdiction ―United States, 2011-2015
| State |
2011
|
2012
|
2013
|
2014
|
2015
|
|||||
|---|---|---|---|---|---|---|---|---|---|---|
| No. | Rate* | No. | Rate* | No. | Rate* | No. | Rate* | No. | Rate* | |
| Alabama | 23 | 0.5 | 24 | 0.5 | 30 | 0.6 | 35 | 0.7 | 70 | 1.4 |
| Alaska | U | U | U | U | U | U | U | U | U | U |
| Arizona | U | U | U | U | U | U | U | U | U | U |
| Arkansas | 0 | 0.0 | 5 | 0.2 | 30 | 1.0 | 13 | 0.4 | 2 | 0.1 |
| California | 48 | 0.1 | 63 | 0.2 | 72 | 0.2 | 73 | 0.2 | 59 | 0.2 |
| Colorado | 28 | 0.5 | 42 | 0.8 | 21 | 0.4 | 33 | 0.6 | 40 | 0.7 |
| Connecticut | 47 | 1.3 | 34 | 0.9 | U | U | U | U | U | U |
| Delaware | 3 | 0.3 | U | U | U | U | U | U | 4 | 0.4 |
| District of Columbia | U | U | U | U | U | U | U | U | U | U |
| Florida | 64 | 0.3 | 107 | 0.6 | 134 | 0.7 | 93 | 0.5 | 126 | 0.6 |
| Georgia | 53 | 0.5 | 82 | 0.8 | 48 | 0.5 | 57 | 0.6 | 84 | 0.8 |
| Hawaii | U | U | U | U | U | U | U | U | U | U |
| Idaho | 12 | 0.8 | 11 | 0.7 | 14 | 0.9 | 6 | 0.4 | 4 | 0.2 |
| Illinois | 6 | 0.0 | 26 | 0.2 | 37 | 0.3 | 27 | 0.2 | 31 | 0.2 |
| Indiana | 84 | 1.3 | 110 | 1.7 | 175 | 2.7 | 122 | 1.8 | 138 | 2.1 |
| Iowa | 0 | 0.0 | 3 | 0.1 | U | U | U | U | U | U |
| Kansas | 8 | 0.3 | 16 | 0.6 | 17 | 0.6 | 28 | 1.0 | 22 | 0.8 |
| Kentucky | 142 | 3.2 | 178 | 4.1 | 226 | 5.1 | 176 | 4.0 | 119 | 2.7 |
| Louisiana | 7 | 0.2 | 11 | 0.2 | 19 | 0.4 | 22 | 0.5 | 24 | 0.5 |
| Maine | 12 | 0.9 | 8 | 0.6 | 8 | 0.6 | 31 | 2.3 | 30 | 2.3 |
| Maryland | 35 | 0.6 | 39 | 0.7 | 53 | 0.9 | 42 | 0.7 | 38 | 0.6 |
| Massachusetts | 23 | 0.3 | 37 | 0.6 | 174 | 2.6 | 228 | 3.4 | 249 | 3.7 |
| Michigan | 32 | 0.3 | 76 | 0.8 | 74 | 0.7 | 78 | 0.8 | 83 | 0.8 |
| Minnesota | 17 | 0.3 | 32 | 0.6 | 47 | 0.9 | 40 | 0.7 | 37 | 0.7 |
| Mississippi | U | U | U | U | U | U | U | U | U | U |
| Missouri | 8 | 0.1 | 4 | 0.1 | 6 | 0.1 | 6 | 0.1 | 8 | 0.1 |
| Montana | 9 | 0.9 | 9 | 0.9 | 16 | 1.6 | 13 | 1.3 | 15 | 1.5 |
| Nebraska | 2 | 0.1 | 3 | 0.2 | 2 | 0.1 | 2 | 0.1 | 8 | 0.4 |
| Nevada | 10 | 0.4 | 12 | 0.4 | 9 | 0.3 | 6 | 0.2 | 12 | 0.4 |
| New Hampshire | U | U | U | U | U | U | U | U | U | U |
| New Jersey | 53 | 0.6 | 71 | 0.8 | 106 | 1.2 | 113 | 1.3 | 130 | 1.5 |
| New Mexico | 14 | 0.7 | 21 | 1.0 | 12 | 0.6 | 16 | 0.8 | 40 | 1.9 |
| New York | 52 | 0.3 | 93 | 0.5 | 131 | 0.7 | 126 | 0.6 | 121 | 0.6 |
| North Carolina | 60 | 0.6 | 63 | 0.6 | 79 | 0.8 | 111 | 1.1 | 144 | 1.4 |
| North Dakota | 0 | 0.0 | 0 | 0.0 | 4 | 0.6 | 0 | 0.0 | 0 | 0.0 |
| Ohio | 6 | 0.1 | 7 | 0.1 | 116 | 1.0 | 105 | 0.9 | 122 | 1.1 |
| Oklahoma | 53 | 1.4 | 80 | 2.1 | 40 | 1.0 | 45 | 1.2 | 35 | 0.9 |
| Oregon | 20 | 0.5 | 37 | 0.9 | 14 | 0.4 | 15 | 0.4 | 13 | 0.3 |
| Pennsylvania | 35 | 0.3 | 66 | 0.5 | 81 | 0.6 | 69 | 0.5 | 129 | 1.0 |
| Rhode Island | U | U | U | U | U | U | U | U | U | U |
| South Carolina | 1 | 0.0 | 1 | 0.0 | 0 | 0.0 | 4 | 0.1 | 5 | 0.1 |
| South Dakota | U | U | U | U | U | U | U | U | U | U |
| Tennessee | 83 | 1.3 | 129 | 2.0 | 98 | 1.5 | 123 | 1.9 | 173 | 2.6 |
| Texas | 37 | 0.1 | 44 | 0.2 | 28 | 0.1 | 47 | 0.2 | 48 | 0.2 |
| Utah | 10 | 0.4 | 17 | 0.6 | 11 | 0.4 | 38 | 1.3 | 30 | 1.0 |
| Vermont | 6 | 1.0 | 6 | 1.0 | 3 | 0.5 | 4 | 0.6 | 1 | 0.2 |
| Virginia | 25 | 0.3 | 76 | 0.9 | 41 | 0.5 | 54 | 0.6 | 52 | 0.6 |
| Washington | 41 | 0.6 | 54 | 0.8 | 63 | 0.9 | 82 | 1.2 | 63 | 0.9 |
| West Virginia | 46 | 2.5 | 55 | 3.0 | 58 | 3.1 | 62 | 3.4 | 63 | 3.4 |
| Wisconsin | 15 | 0.3 | 26 | 0.5 | 40 | 0.7 | 49 | 0.9 | 64 | 1.1 |
| Wyoming | 2 | 0.4 | U | U | U | U | U | U | U | U |
| Total | 1232 | 0.4 | 1778 | 0.6 | 2138 | 0.7 | 2194 | 0.7 | 2436 | 0.8 |
Source: CDC, National Notifiable Diseases Surveillance System.
*Rate per 100,000 population.
U=No data available for reporting.
Table 4.2. Select Clinical Characteristics of Acute Hepatitis C Cases* Reported in the United States, 2015
| Clinical characteristic |
Availability of valid data† for clinical characteristic
|
Cases with clinical characteristic§
|
||
|---|---|---|---|---|
|
No.
|
%
|
No.
|
%
|
|
|
Jaundice
|
1,696 | 69.6 | 927 | 54.7 |
|
Hospitalized for hepatitis C
|
1,552 | 63.7 | 822 | 53.0 |
|
Died from hepatitis C
|
1,318 | 54.1 | 6 | 0.5 |
Source: CDC, National Notifiable Diseases Surveillance System.
*A total of 2,436 acute hepatitis C cases were reported during 2015.
†Case reports for which questions regarding clinical characteristics were answered with “yes” or “no.” Reports with any other response were excluded.
§Numbers and percentages represent only those case reports for which data regarding clinical characteristics were available; numbers likely are underestimates.
Table 4.3. Number of newly reported case* reports† of confirmed past or present Hepatitis C submitted by states and jurisdictions, 2015
| State/Jurisdiction | No. past/present hepatitis C case reports submitted† |
|---|---|
| Alabama | N |
| Alaska | 1,604 |
| Arizona | U |
| Arkansas | 1 |
| California§ | 1,182 |
| Colorado | 3,561 |
| Connecticut | 3,291 |
| Delaware | 31 |
| District of Columbia | U |
| Florida | 22,793 |
| Georgia | 7,175 |
| Hawaii | U |
| Idaho | 1,017 |
| Illinois | 8,696 |
| Indiana | U |
| Iowa | 20 |
| Kansas | 1,697 |
| Kentucky | 4 |
| Louisiana | 2,478 |
| Maine | 1,486 |
| Maryland | 7,425 |
| Massachusetts | 5,482 |
| Michigan | 6,808 |
| Minnesota | 2,015 |
| Mississippi | N |
| Missouri | 7,800 |
| Montana | 1,354 |
| Nebraska | 893 |
| Nevada | N |
| New Hampshire | N |
| New Jersey | 7,928 |
| New Mexico | 3,680 |
| New York | 15,058 |
| North Carolina | N |
| North Dakota | 794 |
| Ohio | 19,165 |
| Oklahoma | 590 |
| Oregon | 5,472 |
| Pennsylvania | 11,988 |
| Rhode Island | U |
| South Carolina | 4,515 |
| South Dakota | 567 |
| Tennessee | 2,251 |
| Texas | N |
| Utah | 1,578 |
| Vermont | 808 |
| Virginia | 8,138 |
| Washington | 5,712 |
| West Virginia | 6,339 |
| Wisconsin | 3 |
| Wyoming | 472 |
| Total | 181,871 |
Source: CDC, National Notifiable Diseases Surveillance System
*For case-definition, see https://wwwn.cdc.gov/nndss/conditions/hepatitis-c-chronic/case-definition/2012/.
†Reports may not reflect unique cases.
§Cases reported by California through NNDSS were all from San Francisco County. Differences in the number of cases in this table and table 4.4 are because NNDSS and CDC’s Secure Access Management System (SAMS) have different data close-out dates by which all annual data must be submitted.
N=Not Reportable, past/present hepatitis C is not reportable in the listed state.
U= No data available for reporting
Table 4.4. Reported cases of past or present hepatitis C, by demographic characteristics and laboratory tests – Enhanced Viral Hepatitis Surveillance Sites, 2015
| Category | FL* No. %§ |
MA No. % |
MI No. % |
NYS† No. % |
Phil No. % |
SF No. % |
WA No. % |
Total No. % |
|---|---|---|---|---|---|---|---|---|
| Sex | ||||||||
| Female | 10,271 | 2,334 | 2,666 | 3,151 | 560 | 431 | 2,236 | 21,649 |
| 40.2% | 39.9% | 37.9% | 37.7% | 33.5% | 27.2% | 37.6% | 38.6% | |
| Male | 15,206 | 3,500 | 4,352 | 5,131 | 1,097 | 1,152 | 3,639 | 34,077 |
| 59.5% | 59.8% | 61.9% | 61.4% | 65.7% | 72.7% | 61.1% | 60.8% | |
| Unknown /missing | 98 | 21 | 14 | 71 | 14 | 2 | 80 | 303 |
| 0.4% | 0.4% | 0.2% | 0.8% | 0.8% | 0.1% | 1.3% | 0.5% | |
| Race/ethnicity | ||||||||
| American Indian/ Alaska Native, NH¶ |
29 | 14 | 58 | 43 | 2 | 5 | 0 | 151 |
| 0.1% | 0.2% | 0.8% | 0.5% | 0.1% | 0.3% | 0.0% | 0.3% | |
| Asian/Pacific Islander, NH | 54 | 97 | 44 | 97 | 13 | 57 | 39 | 404 |
| 0.2% | 1.7% | 0.6% | 1.2% | 0.8% | 3.6% | 0.7% | 0.7% | |
| Black, NH | 957 | 243 | 1,184 | 682 | 153 | 234 | 164 | 3,617 |
| 3.7% | 4.2% | 16.8% | 8.2% | 9.2% | 14.8% | 2.8% | 6.5% | |
| White, NH | 7,519 | 2,566 | 3,346 | 4,067 | 185 | 580 | 1,611 | 19,874 |
| 29.4% | 43.8% | 47.6% | 48.7% | 11.1% | 36.6% | 27.1% | 35.5% | |
| Hispanic | 1,135 | 330 | 112 | 541 | 89 | 116 | 135 | 2,458 |
| 4.4% | 5.6% | 1.6% | 6.5% | 5.3% | 7.3% | 2.3% | 4.4% | |
| Other, NH | 271 | 210 | 86 | 132 | 12 | 0 | 42 | 753 |
| 1.1% | 3.6% | 1.2% | 1.6% | 0.7% | 0.0% | 0.7% | 1.3% | |
| Unknown /missing | 15,610 | 2,395 | 2,202 | 2,791 | 1,217 | 593 | 3,964 | 28,772 |
| 61.0% | 40.9% | 31.3% | 33.4% | 72.8% | 37.4% | 66.6% | 51.0% | |
| Age group, years | ||||||||
| 0-14 | 67 | 25 | 16 | 15 | 10 | 1 | 18 | 152 |
| 0.3% | 0.4% | 0.2% | 0.2% | 0.6% | 0.1% | 0.3% | 0.3% | |
| 15-24 | 2,343 | 794 | 537 | 1,064 | 58 | 35 | 427 | 5,258 |
| 9.2% | 13.6% | 7.6% | 12.7% | 3.5% | 2.2% | 7.2% | 9.4% | |
| 25-39 | 7,071 | 2,197 | 1,795 | 2,720 | 362 | 295 | 1,473 | 15,913 |
| 27.6% | 37.5% | 25.5% | 32.6% | 21.7% | 18.6% | 24.7% | 28.4% | |
| 40-54 | 6,314 | 1,285 | 1,454 | 1,787 | 466 | 452 | 1,590 | 13,348 |
| 24.7% | 21.9% | 20.7% | 21.4% | 27.9% | 28.5% | 26.7% | 23.7% | |
| 55+ | 9,766 | 1,546 | 3,226 | 2,752 | 773 | 792 | 2,438 | 21,293 |
| 38.2% | 26.4% | 45.9% | 32.9% | 46.3% | 50.0% | 40.9% | 38.0% | |
| Unknown /missing | 14 | 8 | 4 | 15 | 2 | 10 | 9 | 62 |
| 0.1% | 0.1% | 0.1% | 0.2% | 0.1% | 0.6% | 0.2% | 0.1% | |
| Hepatitis C laboratory testing** | ||||||||
| Anti-HCV+ | 15,975 | 4,613 | 4,861 | 5,715 | 987 | 977 | 3,862 | 36,990 |
| 62.5% | 78.8% | 69.1% | 68.4% | 59.1% | 61.6% | 64.9% | 66.0% | |
| HCV RNA+ | 15,226 | 4,505 | 2,318 | 5,862 | 1,639 | 1,179 | 2,656 | 33,385 |
| 59.5% | 76.9% | 33.0% | 70.2% | 98.1% | 74.4% | 44.6% | 59.6% | |
| Total no. cases | 25,575 | 5,855 | 7,032 | 8,353 | 1,671 | 1,585 | 5,955 | 56,026 |
| 2015 Estimated population total†† | 20,271,272 | 6,794,422 | 9,922,576 | 11,245,386 | 1,567,442 | 864,816 | 7,170,351 | 57,836,265 |
| Rate per 100,000 population | 126.2 | 86.2 | 70.9 | 74.3 | 106.6 | 183.3 | 83.1 | 96.9 |
Source: CDC, Enhanced Viral Hepatitis Surveillance Sites.
Abbreviations: FL, Florida; MA, Massachusetts; MI, Michigan; NYS, New York State; Phil, Philadelphia; SF, San Francisco; WA, Washington State
*Florida DOH only reported cases from the following 10 counties: Alachua, Broward, Hillsborough, Miami-Dade, Orange, Palm Beach, Pinellas, Polk, Sarasota, and Seminole
†Cases and population estimates from New York excluded those who resided in New York City because New York City was not included in the reported case counts.
§The denominator used to calculate proportions was the total number of cases reported for each site.
NH: Non-Hispanic
** Cases can be reported with more than one laboratory test result.
†† Population estimates for the United States: https://www.census.gov/quickfacts/table/PST045216/00.
HCV: Hepatitis C virus; Anti-HCV: Hepatitis C Antibody: HCV RNA: Ribonucleic acid.
Table 4.5. Number and rate* of hepatitis C-related deaths†, by demographic characteristic and year — United States, 2011-2015
| Demographic characteristic |
2011
|
2012
|
2013
|
2014
|
2015
|
||||||
|---|---|---|---|---|---|---|---|---|---|---|---|
| No. | Rate | No. | Rate | No. | Rate | No. | Rate | No. | Rate | ||
| Age Group (years)§ | 0–34 | 128 | 0.09 | 158 | 0.11 | 121 | 0.08 | 162 | 0.11 | 196 | 0.13 |
| 35–44 | 696 | 1.71 | 622 | 1.54 | 573 | 1.42 | 552 | 1.36 | 597 | 1.47 | |
| 45–54 | 5,073 | 11.34 | 4,749 | 10.73 | 4,344 | 9.93 | 4,118 | 9.48 | 3,676 | 8.51 | |
| 55–64 | 8,330 | 21.89 | 9,235 | 23.93 | 9,899 | 25.18 | 9,999 | 24.95 | 9,702 | 23.73 | |
| 65–74 | 2,136 | 9.50 | 2,515 | 10.49 | 3,004 | 11.91 | 3,390 | 12.84 | 4,023 | 14.60 | |
| >75 | 1,357 | 7.18 | 1,369 | 7.15 | 1,425 | 7.31 | 1,433 | 7.22 | 1,434 | 7.10 | |
| Race/ ethnicity¶ | White, NH (non-Hispanic) | 11,196 | 4.19 | 11,839 | 4.35 | 12,219 | 4.40 | 12,455 | 4.46 | 12,355 | 4.38 |
| Black, NH | 3,167 | 7.89 | 3,232 | 7.81 | 3,520 | 8.35 | 3,540 | 8.12 | 3,606 | 8.14 | |
| Hispanic | 2,555 | 7.15 | 2,668 | 7.19 | 2,699 | 6.91 | 2,767 | 6.81 | 2,699 | 6.40 | |
| Asian/Pacific Islander | 455 | 3.14 | 472 | 3.15 | 495 | 3.09 | 438 | 2.56 | 445 | 2.49 | |
| American Indian/Alaska Native | 275 | 10.61 | 313 | 11.81 | 324 | 12.22 | 317 | 11.2 | 367 | 12.95 | |
| Sex | Male | 12,651 | 7.11 | 13,300 | 7.31 | 13,745 | 7.40 | 13,998 | 7.39 | 14,095 | 7.31 |
| Female | 5,070 | 2.70 | 5,350 | 2.77 | 5,623 | 2.85 | 5,661 | 2.81 | 5,534 | 2.71 | |
| Overall | 17,721 | 4.82 | 18,650 | 4.96 | 19,368 | 5.03 | 19,659 | 5.01 | 19,629 | 4.91 | |
Source: CDC, National Vital Statistics System.
*Rates for race, sex, and overall total are age-adjusted per 100,000 U.S. standard population in 2000.
†Cause of death is defined as the underlying cause of death or one of the multiple causes of death and is based on the International Classification of Diseases, 10th Revision (ICD-10) codes B17.1, and B18.2 (hepatitis C).
§One death in 2011, two deaths in 2012, two deaths in 2013, five deaths in 2014, and one death in 2015 are not represented under the age category due to missing age data.
¶The race/ethnicity category was added starting in 2010 to incorporate bridged race categories. 73 deaths in 2011, 126 deaths in 2012, 111 deaths in 2013, 142 deaths in 2014, and 157 in 2015 are not represented under the race/ethnicity category due to missing data.
Downloads of this slide: PDF PowerPoint
Downloads of this slide: PDF PowerPoint
Downloads of this slide: PDF PowerPoint
Downloads of this slide: PDF PowerPoint
Downloads of this slide: PDF PowerPoint
Downloads of this slide: PDF PowerPoint
Downloads of this slide: PDF PowerPoint
Downloads of this slide: PDF PowerPoint
- Page last reviewed: June 19, 2017
- Page last updated: June 19, 2017
- Content source: