

Surveillance for Viral Hepatitis – United States, 2012
 ShareCompartir
Entire report in a printable format [PDF – 1,392 KB – 54 pages]
Contents
Hepatitis A virus
Index
|
PAGE
|
DESCRIPTION
|
|---|---|
| Table 2.1 | Reported cases of acute hepatitis A, by state ― United States, 2008–2012 |
| Table 2.2 | Clinical characteristics of reported cases of acute hepatitis A ― United States, 2012 |
| Table 2.3 | Number and rate of deaths with hepatitis A listed as a cause of death, by demographic characteristics and year — United States, 2007–2011 |
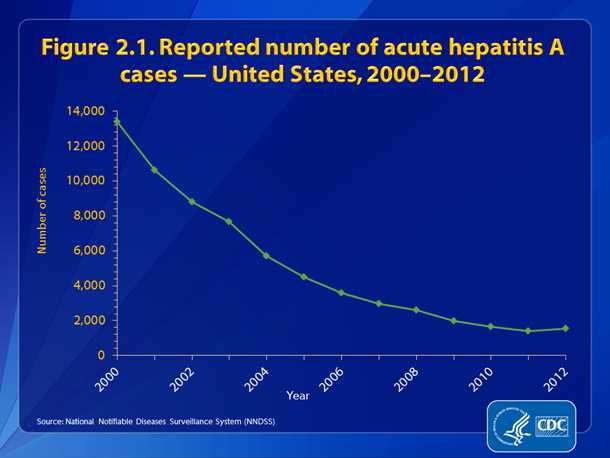
| Figure 2.1 | Reported number of acute hepatitis A cases — United States, 2000-2012 |
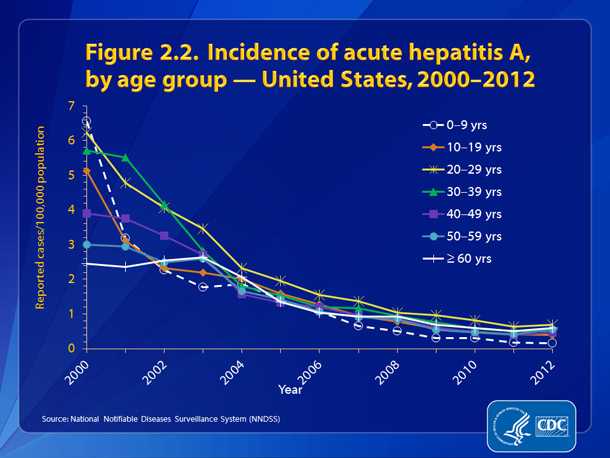
| Figure 2.2 | Incidence of acute, hepatitis A, by age group — United States, 2000-2012 |
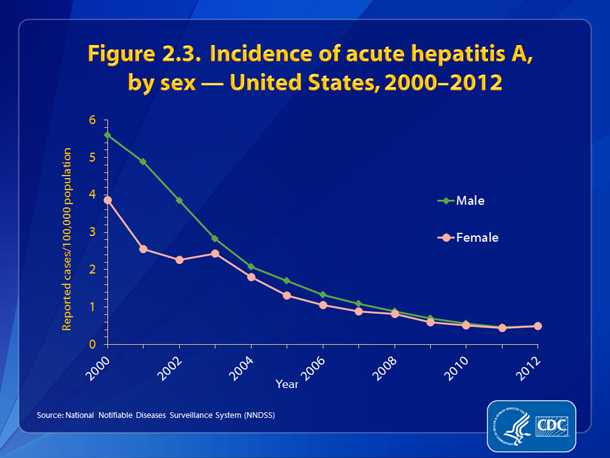
| Figure 2.3 | Incidence of acute, hepatitis A, by sex — United States, 2000-2012 |
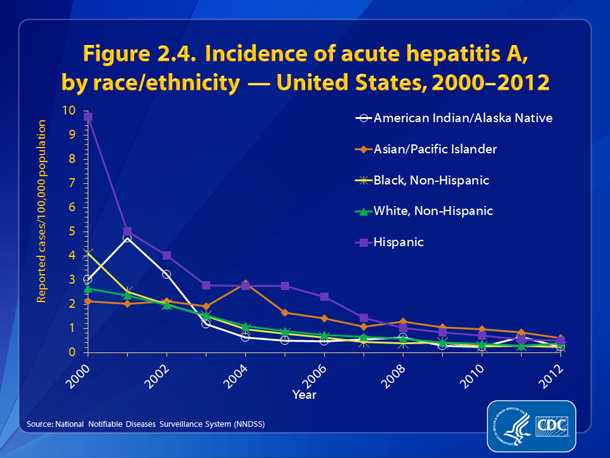
| Figure 2.4 | Incidence of acute, hepatitis A, by race/ethnicity — United States, 2000-2012 |
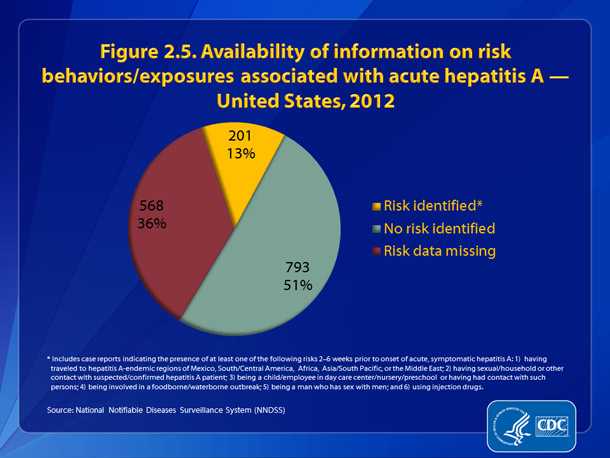
| Figure 2.5 | Availability of information on risk behaviors/exposures associated with acute hepatitis A — United States, 2012 |
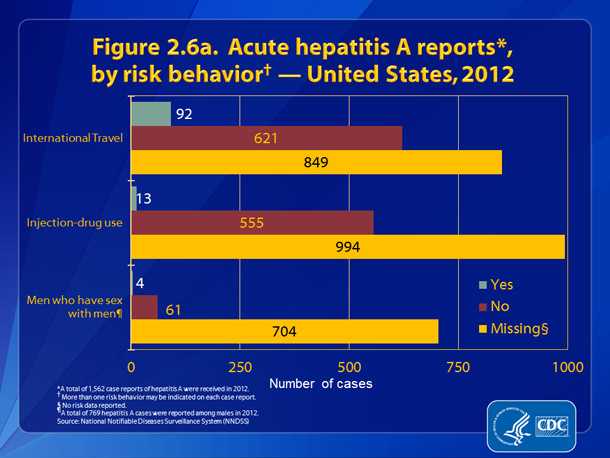
| Figure 2.6a | Acute hepatitis A reports, by risk behavior — United States, 2012 |
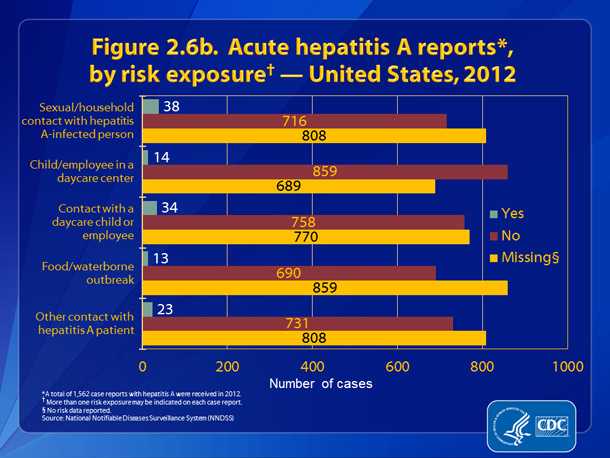
| Figure 2.6b | Acute hepatitis A reports, by risk exposure — United States, 2012 |
Hepatitis A virus
Table 2.1 Reported cases of acute hepatitis A, by state ― United States, 2008–2012
| State |
2008
|
2009
|
2010
|
2011
|
2012
|
|||||
|---|---|---|---|---|---|---|---|---|---|---|
| Rate* | (No.) | Rate | (No.) | Rate | (No.) | Rate | (No.) | Rate | (No.) | |
|
Alabama
|
0.3
|
(12)
|
0.3
|
(12)
|
0.2
|
(8)
|
0.2
|
(8)
|
0.4
|
(19)
|
|
Alaska
|
0.7
|
(5)
|
0.3
|
(2)
|
0.7
|
(5)
|
0.6
|
(4)
|
0.1
|
(1)
|
|
Arizona
|
1.8
|
(118)
|
1.0
|
(68)
|
1.0
|
(61)
|
1.2
|
(77)
|
1.4
|
(93)
|
|
Arkansas
|
0.3
|
(10)
|
0.4
|
(12)
|
0.1
|
(2)
|
0.1
|
(3)
|
0.3
|
(8)
|
|
California
|
1.2
|
(446)
|
0.7
|
(273)
|
0.6
|
(242)
|
0.5
|
(186)
|
0.5
|
(209)
|
|
Colorado
|
0.7
|
(36)
|
1.0
|
(52)
|
0.7
|
(36)
|
0.4
|
(21)
|
0.5
|
(28)
|
|
Connecticut
|
0.7
|
(26)
|
0.5
|
(18)
|
0.8
|
(29)
|
0.5
|
(18)
|
0.6
|
(23)
|
|
Delaware
|
0.8
|
(7)
|
0.5
|
(4)
|
0.8
|
(7)
|
0.2
|
(2)
|
1
|
(9)
|
|
District of Columbia
|
U
|
U
|
0.2
|
(1)
|
0.2
|
(1)
|
U
|
U
|
U
|
U
|
|
Florida
|
0.8
|
(146)
|
0.9
|
(171)
|
0.7
|
(139)
|
0.5
|
(87)
|
0.5
|
(87)
|
|
Georgia
|
0.6
|
(57)
|
0.5
|
(54)
|
0.4
|
(40)
|
0.3
|
(27)
|
0.5
|
(46)
|
|
Hawaii
|
1.6
|
(20)
|
0.8
|
(11)
|
0.6
|
(8)
|
0.6
|
(8)
|
0.4
|
(5)
|
|
Idaho
|
1.1
|
(17)
|
0.3
|
(5)
|
0.5
|
(8)
|
0.4
|
(6)
|
0.7
|
(11)
|
|
Illinois
|
0.9
|
(112)
|
1.0
|
(126)
|
0.4
|
(48)
|
0.6
|
(73)
|
0.5
|
(67)
|
|
Indiana
|
0.3
|
(20)
|
0.3
|
(17)
|
0.2
|
(12)
|
0.4
|
(24)
|
0.2
|
(11)
|
|
Iowa
|
3.6
|
(109)
|
1.3
|
(38)
|
0.4
|
(11)
|
0.3
|
(8)
|
0.2
|
(7)
|
|
Kansas
|
0.5
|
(15)
|
0.4
|
(12)
|
0.5
|
(14)
|
0.1
|
(4)
|
0.5
|
(15)
|
|
Kentucky
|
0.7
|
(30)
|
0.3
|
(12)
|
0.6
|
(26)
|
0.2
|
(10)
|
0.6
|
(25)
|
|
Louisiana
|
0.3
|
(12)
|
0.1
|
(6)
|
0.2
|
(11)
|
0.1
|
(5)
|
0.2
|
(7)
|
|
Maine
|
1.4
|
(18)
|
0.1
|
(1)
|
0.5
|
(7)
|
0.5
|
(6)
|
0.7
|
(9)
|
|
Maryland
|
0.8
|
(44)
|
0.8
|
(47)
|
0.4
|
(23)
|
0.4
|
(26)
|
0.5
|
(28)
|
|
Massachusetts
|
0.9
|
(58)
|
1.1
|
(71)
|
0.7
|
(48)
|
0.6
|
(39)
|
0.6
|
(40)
|
|
Michigan
|
1.2
|
(119)
|
0.7
|
(72)
|
0.7
|
(73)
|
0.7
|
(70)
|
1
|
(100)
|
|
Minnesota
|
0.9
|
(49)
|
0.6
|
(29)
|
0.7
|
(37)
|
0.5
|
(27)
|
0.5
|
(29)
|
|
Mississippi
|
0.2
|
(7)
|
0.3
|
(9)
|
0.1
|
(2)
|
0.2
|
(7)
|
0.4
|
(11)
|
|
Missouri
|
0.6
|
(35)
|
0.4
|
(21)
|
0.4
|
(21)
|
0.2
|
(13)
|
0.3
|
(20)
|
|
Montana
|
0.1
|
(1)
|
0.6
|
(6)
|
0.4
|
(4)
|
0.3
|
(3)
|
0.6
|
(6)
|
|
Nebraska
|
2.3
|
(41)
|
1.2
|
(21)
|
0.8
|
(14)
|
0.3
|
(5)
|
0.9
|
(16)
|
|
Nevada
|
0.5
|
(13)
|
0.6
|
(15)
|
0.5
|
(14)
|
0.2
|
(5)
|
0.4
|
(10)
|
|
New Hampshire
|
0.9
|
(12)
|
0.5
|
(7)
|
0.2
|
(2)
|
0
|
(0)
|
0.5
|
(6)
|
|
New Jersey
|
1.0
|
(86)
|
0.8
|
(71)
|
0.9
|
(76)
|
0.9
|
(79)
|
0.7
|
(60)
|
|
New Mexico
|
0.9
|
(18)
|
0.4
|
(8)
|
0.2
|
(5)
|
0.3
|
(7)
|
0.5
|
(10)
|
|
New York
|
0.9
|
(179)
|
0.7
|
(136)
|
0.8
|
(147)
|
0.6
|
(113)
|
0.6
|
(111)
|
|
North Carolina
|
0.7
|
(63)
|
0.4
|
(41)
|
0.5
|
(48)
|
0.3
|
(31)
|
0.3
|
(34)
|
|
North Dakota
|
0.3
|
(2)
|
0.3
|
(2)
|
0.6
|
(4)
|
0
|
(0)
|
0.3
|
(2)
|
|
Ohio
|
0.4
|
(51)
|
0.3
|
(36)
|
0.4
|
(47)
|
0.3
|
(39)
|
0.3
|
(36)
|
|
Oklahoma
|
0.4
|
(13)
|
0.2
|
(7)
|
0.2
|
(6)
|
0.3
|
(11)
|
0.3
|
(12)
|
|
Oregon
|
0.7
|
(25)
|
0.5
|
(19)
|
0.4
|
(17)
|
0.3
|
(11)
|
0.2
|
(9)
|
|
Pennsylvania
|
0.5
|
(68)
|
0.5
|
(68)
|
0.4
|
(53)
|
0.5
|
(60)
|
0.5
|
(62)
|
|
Rhode Island
|
1.1
|
(12)
|
0.9
|
(9)
|
0.9
|
(9)
|
0.8
|
(8)
|
0.3
|
(3)
|
|
South Carolina
|
0.4
|
(19)
|
1.4
|
(63)
|
0.6
|
(26)
|
0.2
|
(11)
|
0.1
|
(6)
|
|
South Dakota
|
0.5
|
(4)
|
0.4
|
(3)
|
0.1
|
(1)
|
0.2
|
(2)
|
0
|
0
|
|
Tennessee
|
0.5
|
(32)
|
0.2
|
(13)
|
0.2
|
(12)
|
0.4
|
(23)
|
0.4
|
(23)
|
|
Texas
|
1.1
|
(259)
|
0.7
|
(184)
|
0.6
|
(139)
|
0.5
|
(138)
|
0.5
|
(134)
|
|
Utah
|
0.5
|
(13)
|
0.3
|
(7)
|
0.4
|
(12)
|
0.3
|
(8)
|
0.1
|
(4)
|
|
Vermont
|
0.3
|
(2)
|
0.3
|
(2)
|
0
|
0
|
1.0
|
(6)
|
0.3
|
(2)
|
|
Virginia
|
0.7
|
(51)
|
0.5
|
(42)
|
0.6
|
(52)
|
0.4
|
(30)
|
0.6
|
(49)
|
|
Washington
|
0.8
|
(51)
|
0.6
|
(42)
|
0.3
|
(21)
|
0.5
|
(31)
|
0.4
|
(29)
|
|
West Virginia
|
0.3
|
(6)
|
0.3
|
(6)
|
0.8
|
(15)
|
0.4
|
(8)
|
0.4
|
(8)
|
|
Wisconsin
|
0.6
|
(33)
|
0.6
|
(33)
|
0.4
|
(23)
|
0.1
|
(8)
|
0.4
|
(21)
|
|
Wyoming
|
0.6
|
(3)
|
0.4
|
(2)
|
0.7
|
(4)
|
0.4
|
(2)
|
0.2
|
(1)
|
|
Total
|
0.9
|
(2,585)
|
0.6
|
(1,987)
|
0.5
|
(1,670)
|
0.4
|
(1,398)
|
0.5
|
(1,562)
|
*Rate per 100,000 population. †U=No data available for reporting.
Table 2.2 Clinical characteristics of reported cases of acute hepatitis A* ― United States, 2012
| Clinical characteristic |
Availability of valid data† for clinical characteristic
|
Cases with clinical characteristic§
|
||
|---|---|---|---|---|
|
No.
|
%
|
No.
|
%
|
|
|
Jaundice
|
1,018
|
65.2
|
652
|
64
|
|
Hospitalized for hepatitis A
|
1,022
|
65.4
|
468
|
45.8
|
|
Died from hepatitis A
|
938
|
60.1
|
6
|
0.6
|
*A total of 1,562 hepatitis A cases were reported during 2012.
†Case reports for which questions regarding clinical characteristics were answered with “yes” or “no.” Reports with any other response were excluded.
§Numbers and percentages represent only those case reports for which data regarding clinical characteristics were available; numbers likely are underestimates.
Table 2.3 Number and rate* of deaths with hepatitis A listed as a cause of death†, by demographic characteristic and year — United States, 2007–2011
| Demographic characterisic |
2007
|
2008
|
2009
|
2010
|
2011
|
||||||
|---|---|---|---|---|---|---|---|---|---|---|---|
| No. | Rate | No. | Rate | No. | Rate | No. | Rate | No. | Rate | ||
| Age Group (years) |
0–34 | 6 | 0.00 | 0 | 0.00 | 1 | 0.00 | 3 | 0.00 | 0 | 0.00 |
| 35–44 | 3 | 0.01 | 1 | 0.00 | 1 | 0.00 | 7 | 0.02 | 1 | 0.00 | |
| 45–54 | 21 | 0.05 | 23 | 0.05 | 14 | 0.03 | 25 | 0.06 | 11 | 0.02 | |
| 55–64 | 20 | 0.06 | 24 | 0.07 | 22 | 0.06 | 34 | 0.09 | 16 | 0.04 | |
| 65–74 | 14 | 0.07 | 12 | 0.06 | 12 | 0.06 | 10 | 0.05 | 12 | 0.05 | |
| ≥75 | 21 | 0.11 | 23 | 0.12 | 32 | 0.17 | 16 | 0.09 | 29 | 0.15 | |
| Race | White§ | 70 | 0.03 | 63 | 0.02 | 68 | 0.02 | ||||
| Black¶ | 14 | 0.04 | 13 | 0.04 | 13 | 0.04 | |||||
| Non-White, non-Black** | 1 | 0.01 | 7 | 0.04 | 1 | 0.00 | |||||
| Race/ Ethnicity |
White, non- Hispanic |
65 | 0.03 | 44 | 0.02 | ||||||
| Black, non- Hispanic |
15 | 0.04 | 10 | 0.03 | |||||||
| Hispanic | 12 | 0.03 | 6 | 0.02 | |||||||
| Asian/Pacific Islander |
2 | 0.02 | 8 | 0.06 | |||||||
| American Indian/Alaskan Native |
1 | 0.05 | 1 | 0.04 | |||||||
| Sex | Male | 61 | 0.04 | 51 | 0.03 | 50 | 0.03 | 73 | 0.05 | 37 | 0.02 |
| Female | 24 | 0.01 | 32 | 0.02 | 32 | 0.02 | 22 | 0.01 | 32 | 0.02 | |
| Overall | 85 | 0.03 | 83 | 0.02 | 82 | 0.02 | 95 | 0.03 | 69 | 0.02 | |
* Rates for race, sex, and overall total are age-adjusted per 100,000 U.S. standard population.
†Cause of death is defined as the underlying cause of death or one of the multiple causes of death and is based on the International Classification of Diseases, 10th Revision (ICD-10) codes B15 (hepatitis A).
§Included white, non-Hispanic and white Hispanic.
¶Included black, non-Hispanic and black Hispanic.
**Included all other racial/ethnic groups.
Source: CDC. National Vital Statistics System.
All seven figure slides in PowerPoint 2007 format [PPTX – 832KB]
Hepatitis B virus
Index
|
PAGE
|
DESCRIPTION
|
|---|---|
| Table 3.1 | Reported cases of acute hepatitis B, by state ― United States, 2008–2012 |
| Table 3.2 | Clinical characteristics of reported cases of acute symptomatic hepatitis B ― United States, 2012 |
| Table 3.3 | Number of laboratory-confirmed, chronic hepatitis B case reports — National Notifiable Diseases Surveillance System (NNDSS), 2012 |
| Table 3.4 | Number and rate of deaths with hepatitis B listed as a cause of death, by demographic characteristic and year – United States, 2007-2011 |
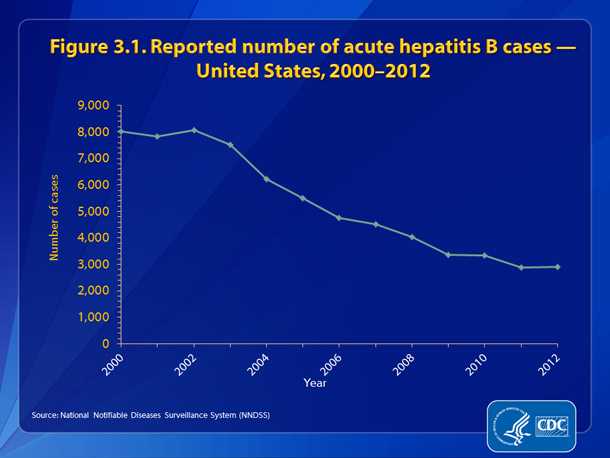
| Figure 3.1 | Reported number of acute hepatitis B cases — United States, 2000-2012 |
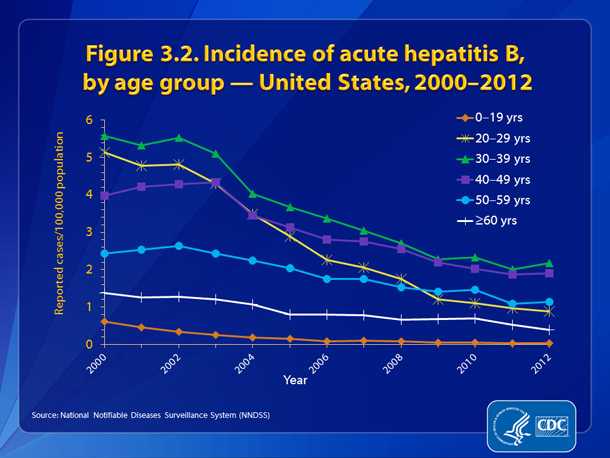
| Figure 3.2 | Incidence of acute hepatitis B, by age group — United States, 2000-2012 |
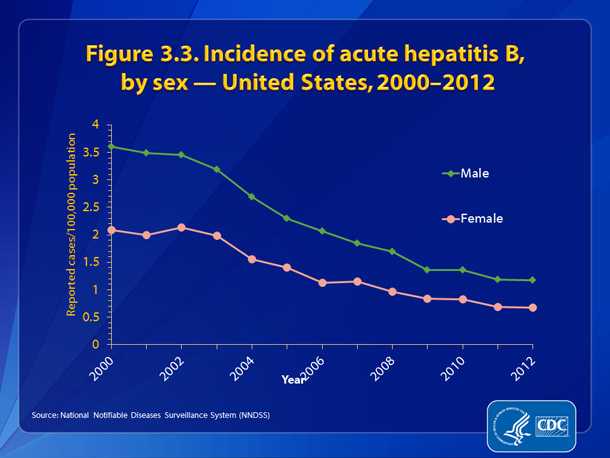
| Figure 3.3 | Incidence of acute hepatitis B, by sex — United States, 2000-2012 |
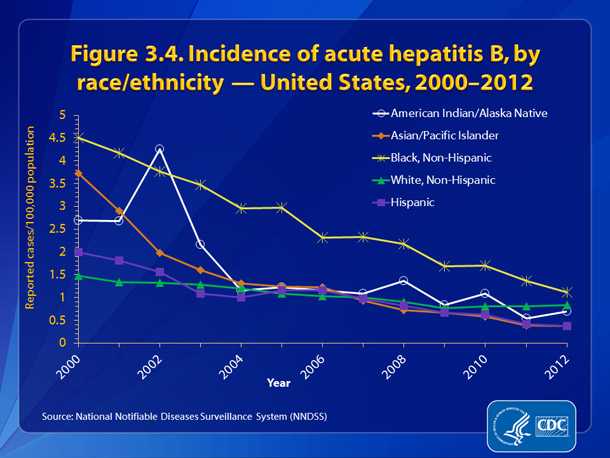
| Figure 3.4 | Incidence of acute hepatitis B, by race/ethnicity — United States, 2000-2012 |
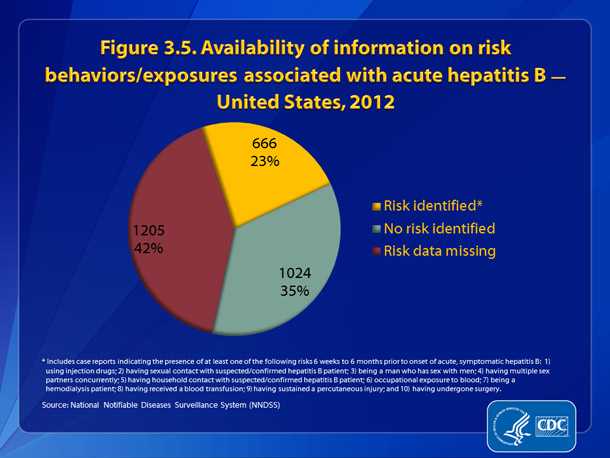
| Figure 3.5 | Availability of information on risk behaviors/exposures associated with acute hepatitis B — United States, 2012 |
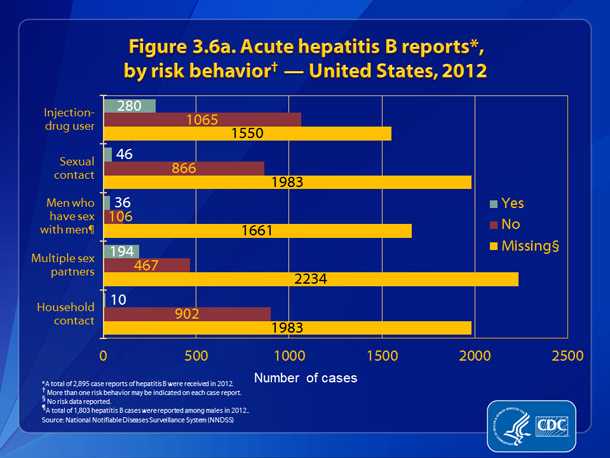
| Figure 3.6a | Acute hepatitis B reports, by risk behavior — United States, 2012 |
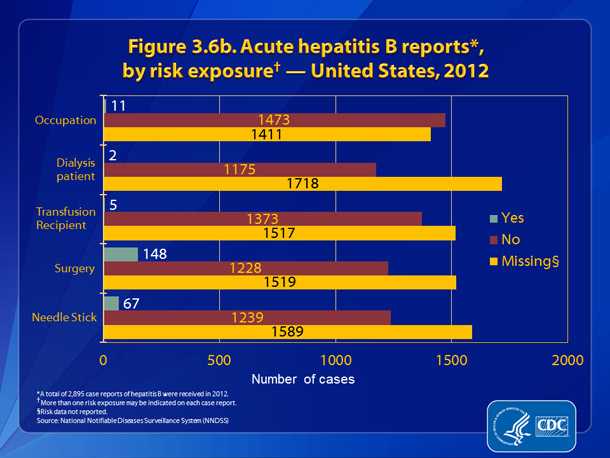
| Figure 3.6b | Acute hepatitis B reports, by risk exposure — United States, 2012 |
Hepatitis B virus
Table 3.1 Reported cases of acute, hepatitis B, by state ― United States, 2008–2012
| State |
2008
|
2009
|
2010
|
2011
|
2012
|
|||||
|---|---|---|---|---|---|---|---|---|---|---|
| Rate* | (No.) | Rate | (No.) | Rate | (No.) | Rate | (No.) | Rate | (No.) | |
|
Alabama
|
2.3
|
(109)
|
1.9
|
(89)
|
1.4
|
(68)
|
2.5
|
|
1.6
|
(79)
|
|
Alaska
|
1.5
|
(10)
|
0.6
|
(4)
|
0.7
|
(5)
|
0.4
|
(3)
|
0.1
|
(1)
|
|
Arizona
|
1.2
|
(80)
|
0.6
|
(42)
|
0.4
|
(26)
|
0.2
|
(14)
|
0.2
|
(14)
|
|
Arkansas
|
2.3
|
(67)
|
2.2
|
(65)
|
2.3
|
(66)
|
1.9
|
(57)
|
2.5
|
(74)
|
|
California
|
0.8
|
(303)
|
0.7
|
(258)
|
0.7
|
(252)
|
0.4
|
(157)
|
0.4
|
(136)
|
|
Colorado
|
0.7
|
(33)
|
0.5
|
(27)
|
0.9
|
(46)
|
0.4
|
(23)
|
0.5
|
(24)
|
|
Connecticut
|
0.9
|
(30)
|
0.5
|
(16)
|
0.6
|
(22)
|
0.5
|
(19)
|
0.4
|
(15)
|
|
Delaware
|
U†
|
U
|
U
|
U
|
U
|
U
|
U
|
U
|
1.2
|
(11)
|
|
District of Columbia
|
U
|
U
|
1.7
|
(10)
|
0.5
|
(3)
|
U
|
U
|
U
|
U
|
|
Florida
|
1.9
|
(344)
|
1.6
|
(299)
|
1.6
|
(297)
|
1.1
|
(213)
|
1.3
|
(247)
|
|
Georgia
|
1.9
|
(187)
|
1.5
|
(144)
|
1.7
|
(165)
|
1.4
|
(142)
|
1.1
|
(109)
|
|
Hawaii
|
0.5
|
(7)
|
0.5
|
(6)
|
0.4
|
(6)
|
0.4
|
(6)
|
0.4
|
(5)
|
|
Idaho
|
0.8
|
(12)
|
0.7
|
(11)
|
0.4
|
(6)
|
0.1
|
(2)
|
0.3
|
(5)
|
|
Illinois
|
1.4
|
(184)
|
0.9
|
(118)
|
1.1
|
(135)
|
0.7
|
(85)
|
0.7
|
(86)
|
|
Indiana
|
1.0
|
(67)
|
1.2
|
(74)
|
1.2
|
(75)
|
1.1
|
(70)
|
1.4
|
(90)
|
|
Iowa
|
0.8
|
(24)
|
1.2
|
(37)
|
0.5
|
(15)
|
0.5
|
(15)
|
0.4
|
(13)
|
|
Kansas
|
0.3
|
(9)
|
0.2
|
(6)
|
0.4
|
(11)
|
0.5
|
(15)
|
0.3
|
(9)
|
|
Kentucky
|
2.4
|
(101)
|
2.1
|
(90)
|
3.1
|
(136)
|
3.5
|
(151)
|
4.1
|
(180)
|
|
Louisiana
|
2.1
|
(94)
|
1.6
|
(73)
|
1.2
|
(55)
|
1.4
|
(62)
|
1
|
(44)
|
|
Maine
|
1.1
|
(15)
|
1.1
|
(15)
|
1.0
|
(13)
|
0.6
|
(8)
|
0.7
|
(9)
|
|
Maryland
|
1.5
|
(85)
|
1.3
|
(72)
|
1.2
|
(67)
|
1.1
|
(62)
|
0.9
|
(52)
|
|
Massachusetts
|
0.3
|
(21)
|
0.3
|
(17)
|
0.2
|
(13)
|
1.0
|
(67)
|
1.1
|
(75)
|
|
Michigan
|
1.5
|
(149)
|
1.3
|
(132)
|
1.2
|
(122)
|
0.9
|
(91)
|
0.8
|
(81)
|
|
Minnesota
|
0.5
|
(25)
|
0.7
|
(38)
|
0.4
|
(23)
|
0.4
|
(20)
|
0.3
|
(17)
|
|
Mississippi
|
1.7
|
(50)
|
1.1
|
(33)
|
1.1
|
(33)
|
1.9
|
(57)
|
2.6
|
(78)
|
|
Missouri
|
0.6
|
(38)
|
0.8
|
(47)
|
1.1
|
(67)
|
1.0
|
(60)
|
0.8
|
(48)
|
|
Montana
|
0.2
|
(2)
|
0.1
|
(1)
|
0
|
(0)
|
0
|
(0)
|
0.2
|
(2)
|
|
Nebraska
|
0.5
|
(9)
|
1.2
|
(22)
|
0.7
|
(12)
|
0.7
|
(12)
|
0.5
|
(10)
|
|
Nevada
|
1.6
|
(43)
|
1.3
|
(34)
|
1.5
|
(41)
|
1.1
|
(29)
|
1
|
(28)
|
|
New Hampshire
|
0.6
|
(8)
|
0.5
|
(6)
|
0.4
|
(5)
|
0.2
|
(3)
|
0.3
|
(4)
|
|
New Jersey
|
1.4
|
(118)
|
1.1
|
(93)
|
0.9
|
(77)
|
0.8
|
(73)
|
0.8
|
(70)
|
|
New Mexico
|
0.6
|
(12)
|
0.4
|
(8)
|
0.2
|
(5)
|
0.5
|
(10)
|
0.1
|
(3)
|
|
New York
|
0.9
|
(173)
|
0.7
|
(129)
|
0.7
|
(139)
|
0.7
|
(134)
|
0.6
|
(113)
|
|
North Carolina
|
0.9
|
(81)
|
1.1
|
(104)
|
1.2
|
(113)
|
1.1
|
(109)
|
0.7
|
(73)
|
|
North Dakota
|
0.3
|
(2)
|
0
|
(0)
|
0
|
(0)
|
0
|
(0)
|
0
|
0
|
|
Ohio
|
1.0
|
(118)
|
0.8
|
(88)
|
0.8
|
(95)
|
0.8
|
(90)
|
1.5
|
(178)
|
|
Oklahoma
|
3.5
|
(129)
|
3.3
|
(122)
|
3.1
|
(115)
|
2.6
|
(100)
|
2.1
|
(79)
|
|
Oregon
|
1.1
|
(41)
|
1.2
|
(44)
|
1.1
|
(42)
|
0.8
|
(32)
|
0.6
|
(25)
|
|
Pennsylvania
|
1.2
|
(157)
|
0.8
|
(106)
|
0.6
|
(72)
|
0.7
|
(84)
|
0.5
|
(63)
|
|
Rhode Island
|
U
|
U
|
U
|
U
|
U
|
U
|
U
|
U
|
U
|
U
|
|
South Carolina
|
1.6
|
(71)
|
1.2
|
(56)
|
1.3
|
(59)
|
0.8
|
(39)
|
0.8
|
(37)
|
|
South Dakota
|
0
|
(0)
|
0.5
|
(4)
|
0.2
|
(2)
|
0.2
|
(2)
|
0.2
|
(2)
|
|
Tennessee
|
2.4
|
(149)
|
2.2
|
(136)
|
2.4
|
(150)
|
3.0
|
(192)
|
3.7
|
(240)
|
|
Texas
|
2.3
|
(562)
|
1.7
|
(420)
|
1.6
|
(394)
|
0.8
|
(204)
|
0.7
|
(170)
|
|
Utah
|
0.5
|
(14)
|
0.2
|
(5)
|
0.3
|
(8)
|
0.4
|
(10)
|
0.5
|
(13)
|
|
Vermont
|
0.5
|
(3)
|
0
|
(0)
|
0.3
|
(2)
|
0
|
(0)
|
0.3
|
(2)
|
|
Virginia
|
1.7
|
(130)
|
1.4
|
(110)
|
1.2
|
(97)
|
1.0
|
(84)
|
1
|
(84)
|
|
Washington
|
0.9
|
(56)
|
0.7
|
(48)
|
0.7
|
(50)
|
0.5
|
(35)
|
0.5
|
(34)
|
|
West Virginia
|
4.6
|
(83)
|
4.6
|
(84)
|
4.7
|
(88)
|
6.1
|
(113)
|
7.6
|
(141)
|
|
Wisconsin
|
0.3
|
(18)
|
0.4
|
(24)
|
0.9
|
(54)
|
0.3
|
(17)
|
0.4
|
(22)
|
|
Wyoming
|
1.1
|
(6)
|
0.7
|
(4)
|
0.5
|
(3)
|
0
|
(0)
|
0
|
0
|
|
Total
|
1.3
|
(4,029)
|
1.1
|
(3,371)
|
1.1
|
(3,350)
|
0.9
|
(2,890)
|
0.9
|
(2,895)
|
*Rate per 100,000 population.
†U=No data available for reporting.
Table 3.2 Clinical characteristics of reported cases of acute, symptomatic hepatitis B* ― United States, 2012
| Clinical characteristic |
Availability of valid data† for clinical characteristic
|
Cases with clinical characteristic§
|
||
|---|---|---|---|---|
|
No.
|
%
|
No.
|
%
|
|
|
Jaundice
|
2,072
|
71.6
|
1,565
|
75.5
|
|
Hospitalized for hepatitis B
|
1,997
|
69.0
|
1,198
|
60.0
|
|
Died from hepatitis B
|
1,846
|
63.8
|
20
|
1.1
|
*A total of 2,895 hepatitis B cases were reported during 2012.
†Case reports for which questions regarding clinical characteristics were answered with “yes” or “no.” Reports with any other response were excluded.
§Numbers and percentages represent only those case reports for which data regarding clinical characteristics were available; numbers likely are underestimates.
Table 3.3 Number of laboratory-confirmed, chronic hepatitis B* case reports† — National Notifiable Diseases Surveillance System (NNDSS), 2012
| Jurisdiction^ | No. chronic hepatitis B case reports submitted |
|---|---|
|
Arizona
|
892
|
|
Colorado
|
458
|
|
Connecticut §
|
562
|
|
Delaware
|
149
|
|
Illinois
|
1,714
|
|
Kansas
|
112
|
|
Louisiana
|
603
|
|
Maine
|
105
|
|
Massachusetts
|
1,750
|
|
Michigan
|
1,416
|
|
Montana
|
25
|
|
New York §
|
1,611
|
|
New York City
|
12,002
|
|
North Carolina
|
888
|
|
Pennsylvania §
|
1,952
|
|
South Carolina
|
463
|
|
South Dakota
|
51
|
|
Vermont
|
28
|
|
West Virginia
|
163
|
|
Wyoming §
|
6
|
| Total |
24,950
|
* For case-definition, see
http://wwwn.cdc.gov/nndss/script/ConditionList.aspx?Type=0&Yr=2012
†Reports may not reflect unique cases.
§Includes probable and confirmed case reports.
^Jurisdictions that gave permission to report their chronic HBV cases
Table 3.4. Number and rate* of deaths with hepatitis B listed as a cause of death†, by demographic characteristic and year — United States, 2007–2011
| Demographic characteristic |
2007
|
2008
|
2009
|
2010
|
2011
|
||||||
|---|---|---|---|---|---|---|---|---|---|---|---|
| No. | Rate | No. | Rate | No. | Rate | No. | Rate | No. | Rate | ||
| Age Group (years) |
0–34 | 62 | 0.04 | 44 | 0.03 | 39 | 0.03 | 48 | 0.03 | 41 | 0.03 |
| 35–44 | 184 | 0.43 | 154 | 0.36 | 143 | 0.34 | 142 | 0.35 | 143 | 0.35 | |
| 45–54 | 532 | 1.21 | 533 | 1.20 | 469 | 1.05 | 448 | 1.00 | 421 | 0.94 | |
| 55–64 | 546 | 1.67 | 523 | 1.55 | 547 | 1.57 | 610 | 1.67 | 645 | 1.69 | |
| 65–74 | 266 | 1.37 | 271 | 1.35 | 254 | 1.22 | 296 | 1.36 | 285 | 1.27 | |
| ≥75 | 225 | 1.21 | 263 | 1.40 | 245 | 1.30 | 248 | 1.34 | 269 | 1.42 | |
| Race | White§ | 1,081 | 0.40 | 1,093 | 0.40 | 978 | 0.35 | ||||
| Black¶ | 359 | 1.03 | 327 | 0.92 | 320 | 0.87 | |||||
| Non-White, non-Black** | 375 | 2.16 | 368 | 2.05 | 399 | 2.15 | |||||
| Race/ Ethnicity |
White, non- Hispanic |
856 | 0.34 | 832 | 0.32 | ||||||
| Black, non- Hispanic |
356 | 0.94 | 373 | 0.98 | |||||||
| Hispanic | 136 | 0.43 | 161 | 0.48 | |||||||
| Asian/Pacific Islander |
421 | 2.95 | 422 | 2.72 | |||||||
| American Indian/Alaskan Native |
17 | 0.73 | 9 | 0.38 | |||||||
| Sex | Male | 1,345 | 0.88 | 1,315 | 0.85 | 1,267 | 0.80 | 1,316 | 0.81 | 1,321 | 0.80 |
| Female | 470 | 0.28 | 473 | 0.27 | 430 | 0.24 | 476 | 0.27 | 483 | 0.26 | |
|
Overall
|
1,815 | 0.56 | 1,788 | 0.54 | 1,697 | 0.51 | 1,792 | 0.52 | 1,804 | 0.52 | |
* Rates for race, sex, and overall total are age-adjusted per 100,000 U.S. standard population.
†Cause of death is defined as the underlying cause of death or one of the multiple causes of death and is based on the International Classification of Diseases, 10th Revision (ICD-10) codes B16, B17.0, B18.0, and B18.1(hepatitis B).
§Included white, non-Hispanic and white Hispanic.
¶Included black, non-Hispanic and black Hispanic.
**Included all other racial/ethnic groups.
Source: CDC. National Vital Statistics System.
Downloads of this slide: PDF PowerPoint
Downloads of this slide: PDF PowerPoint
Downloads of this slide: PDF PowerPoint
Downloads of this slide: PDF PowerPoint
Downloads of this slide: PDF PowerPoint
Downloads of this slide: PDF PowerPoint
Downloads of this slide: PDF PowerPoint
All seven figure slides in PowerPoint 2007 format [PPTX – 866 KB]
Hepatitis C virus
Index
|
PAGE
|
DESCRIPTION
|
|---|---|
| Table 4.1 | Reported cases of acute hepatitis C, by state ― United States, 2008–2012 |
| Table 4.2 | Clinical characteristics of reported cases of acute hepatitis C ― United States, 2012 |
| Table 4.3 | Number of laboratory confirmed, hepatitis C (past or present) case reports — National Notifiable Diseases Surveillance System (NNDSS), 2012 |
| Table 4.4 | Number and rate of deaths with hepatitis C listed as a cause of death, by demographic characteristic and year — United States, 2007–2011 |
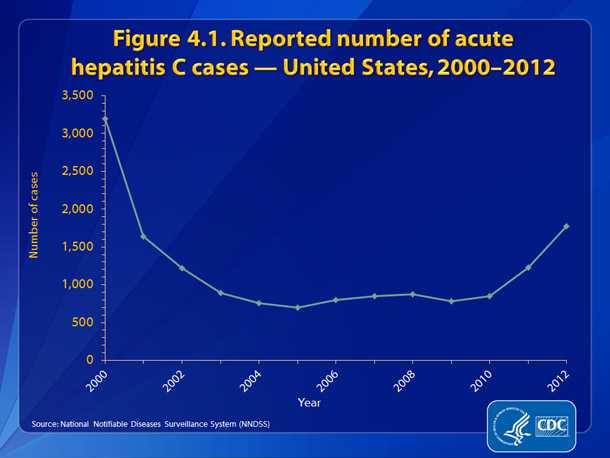
| Slide 4.1 | Reported number of acute hepatitis hepatitis C cases — United States, 2000-2012 |
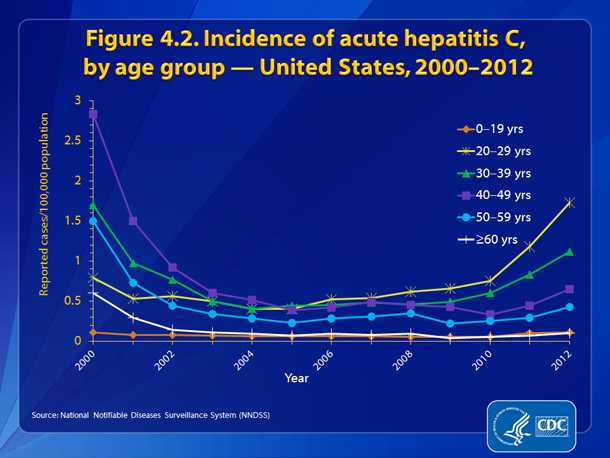
| Slide 4.2 | Incidence of acute hepatitis C, by age group — United States, 2000-2012 |
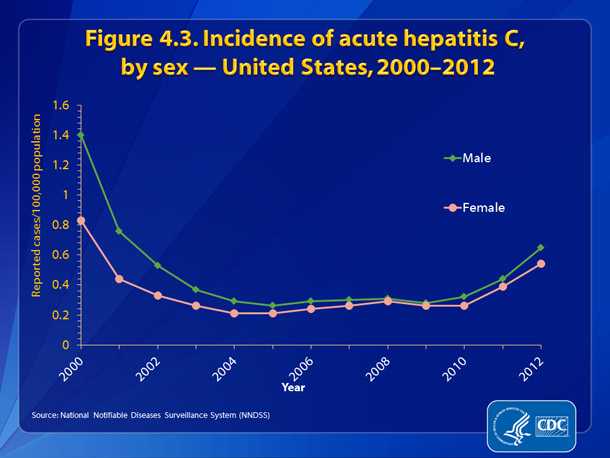
| Slide 4.3 | Incidence of acute hepatitis C, by sex — United States, 2000-2012 |
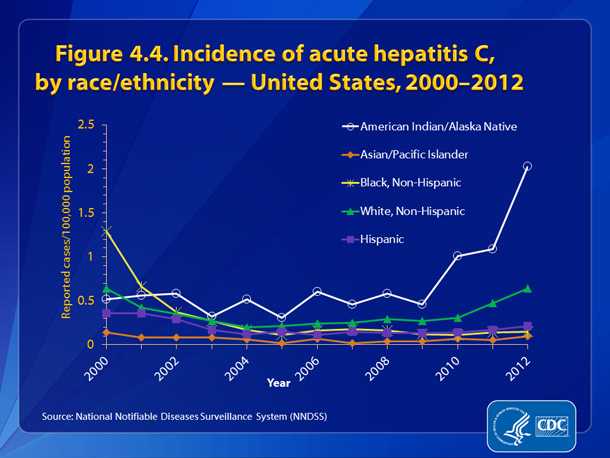
| Slide 4.4 | Incidence of acute hepatitis C, by race/ethnicity — United States, 2000-2012 |
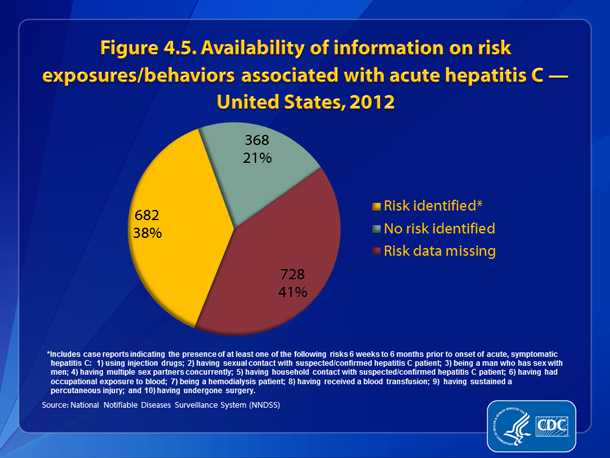
| Slide 4.5 | Availability of information on risk exposures/behaviors associated with acute hepatitis C — United States, 2012 |
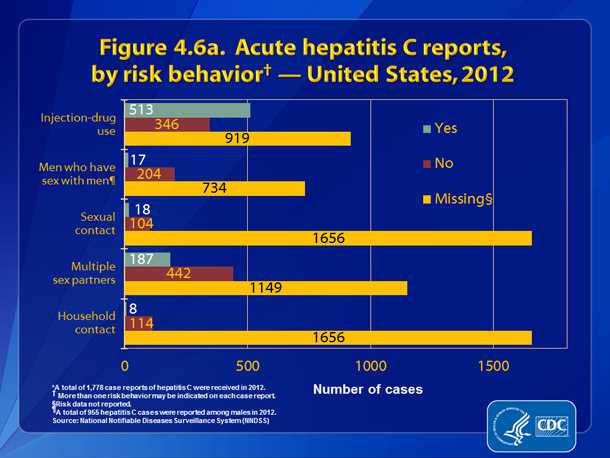
| Slide 4.6a | Acute hepatitis C reports, by risk behavior — United States, 2012 |
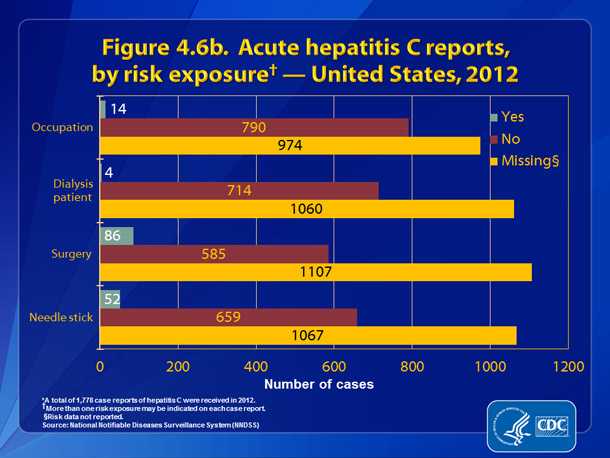
| Slide 4.6b | Acute hepatitis C reports, by risk exposure — United States, 2012 |
Hepatitis C virus
Table 4.1 Reported cases of acute, hepatitis C, by state ― United States, 2008–2012
| State |
2008
|
2009
|
2010
|
2011
|
2012
|
|||||
|---|---|---|---|---|---|---|---|---|---|---|
| Rate* | (No.) | Rate | (No.) | Rate | (No.) | Rate | (No.) | Rate | (No.) | |
|
Alabama
|
0.3
|
(13)
|
0.2
|
(10)
|
0.1
|
(7)
|
0.5
|
(23)
|
0.5
|
(24)
|
|
Alaska
|
U†
|
U
|
U
|
U
|
U
|
U
|
U
|
U
|
U
|
U
|
|
Arizona
|
U
|
U
|
U
|
U
|
U
|
U
|
U
|
U
|
U
|
U
|
|
Arkansas
|
0
|
(1)
|
0.1
|
(2)
|
0
|
(1)
|
0
|
(0)
|
0.2
|
(5)
|
|
California
|
0.1
|
(30)
|
0.1
|
(43)
|
0.1
|
(32)
|
0.1
|
(48)
|
0.2
|
(63)
|
|
Colorado
|
0.3
|
(14)
|
0.6
|
(28)
|
0.4
|
(20)
|
0.5
|
(28)
|
0.8
|
(42)
|
|
Connecticut
|
0.5
|
(19)
|
1.5
|
(53)
|
1.0
|
(37)
|
1.3
|
(47)
|
0.9
|
(34)
|
|
Delaware
|
U
|
U
|
U
|
U
|
U
|
U
|
U
|
U
|
U
|
U
|
|
District of Columbia
|
U
|
U
|
0.2
|
(1)
|
0.3
|
(2)
|
U
|
U
|
U
|
U
|
|
Florida
|
0.2
|
(32)
|
0.3
|
(53)
|
0.3
|
(56)
|
0.3
|
(64)
|
0.6
|
(107)
|
|
Georgia
|
0.2
|
(16)
|
0.3
|
(31)
|
0.3
|
(32)
|
0.5
|
(53)
|
0.8
|
(82)
|
|
Hawaii
|
U
|
U
|
U
|
U
|
U
|
U
|
U
|
U
|
U
|
U
|
|
Idaho
|
0.2
|
(3)
|
0.5
|
(7)
|
0.7
|
(11)
|
0.8
|
(12)
|
0.7
|
(11)
|
|
Illinois
|
0.1
|
(10)
|
0
|
(6)
|
0
|
(1)
|
0
|
(6)
|
0.2
|
(26)
|
|
Indiana
|
0.2
|
(13)
|
0.3
|
(22)
|
0.4
|
(27)
|
1.3
|
(84)
|
1.7
|
(110)
|
|
Iowa
|
0
|
(0)
|
0.4
|
(11)
|
0
|
0
|
0
|
(0)
|
0.1
|
(3)
|
|
Kansas
|
0
|
(1)
|
0
|
(1)
|
0.1
|
(2)
|
0.3
|
(8)
|
0.6
|
(16)
|
|
Kentucky
|
1.6
|
(68)
|
1.5
|
(64)
|
2.5
|
(109)
|
3.2
|
(142)
|
4.1
|
(178)
|
|
Louisiana
|
0.2
|
(9)
|
0.2
|
(9)
|
0.1
|
(4)
|
0.2
|
(7)
|
0.2
|
(11)
|
|
Maine
|
0.2
|
(3)
|
0.2
|
(2)
|
0.2
|
(2)
|
0.9
|
(12)
|
0.6
|
(8)
|
|
Maryland
|
0.4
|
(22)
|
0.4
|
(23)
|
0.4
|
(24)
|
0.6
|
(35)
|
0.7
|
(39)
|
|
Massachusetts
|
0.2
|
(13)
|
0.2
|
(10)
|
0.2
|
(13)
|
0.3
|
(23)
|
0.6
|
(37)
|
|
Michigan
|
1.3
|
(129)
|
0.4
|
(35)
|
0.5
|
(45)
|
0.3
|
(32)
|
0.8
|
(76)
|
|
Minnesota
|
0.4
|
(22)
|
0.3
|
(15)
|
0.3
|
(16)
|
0.3
|
(17)
|
0.6
|
(32)
|
|
Mississippi
|
U
|
U
|
U
|
U
|
U
|
U
|
U
|
U
|
U
|
U
|
|
Missouri
|
0
|
(2)
|
0
|
(0)
|
0.1
|
(6)
|
0.1
|
(8)
|
0.1
|
(4)
|
|
Montana
|
0.6
|
(6)
|
0.1
|
(1)
|
0.4
|
(4)
|
0.9
|
(9)
|
0.9
|
(9)
|
|
Nebraska
|
0.1
|
(2)
|
0.2
|
(3)
|
0.1
|
(2)
|
0.1
|
(2)
|
0.2
|
(3)
|
|
Nevada
|
0.8
|
(22)
|
0.2
|
(5)
|
0.3
|
(7)
|
0.4
|
(10)
|
0.4
|
(12)
|
|
New Hampshire
|
U
|
U
|
U
|
U
|
U
|
U
|
U
|
U
|
U
|
U
|
|
New Jersey
|
0.7
|
(61)
|
0.1
|
(7)
|
0.3
|
(28)
|
0.6
|
(53)
|
0.8
|
(71)
|
|
New Mexico
|
0.3
|
(5)
|
0.3
|
(6)
|
0.7
|
(14)
|
0.7
|
(14)
|
1
|
(21)
|
|
New York
|
0.2
|
(43)
|
0.3
|
(53)
|
0.3
|
(50)
|
0.3
|
(52)
|
0.5
|
(93)
|
|
North Carolina
|
0.5
|
(46)
|
0.3
|
(24)
|
0.4
|
(39)
|
0.6
|
(60)
|
0.6
|
(63)
|
|
North Dakota
|
0
|
(0)
|
0.3
|
(2)
|
0
|
(0)
|
0
|
(0)
|
0
|
0
|
|
Ohio
|
0.3
|
(40)
|
0.2
|
(26)
|
0.1
|
(10)
|
0.1
|
(6)
|
0.1
|
(7)
|
|
Oklahoma
|
0.5
|
(20)
|
0.7
|
(27)
|
1.1
|
(41)
|
1.4
|
(53)
|
2.1
|
(80)
|
|
Oregon
|
0.6
|
(23)
|
0.5
|
(19)
|
0.5
|
(19)
|
0.5
|
(20)
|
0.9
|
(37)
|
|
Pennsylvania
|
0.2
|
(27)
|
0.3
|
(39)
|
0.2
|
(26)
|
0.3
|
(35)
|
0.5
|
(66)
|
|
Rhode Island
|
U
|
U
|
U
|
U
|
U
|
U
|
U
|
U
|
U
|
U
|
|
South Carolina
|
0.1
|
(4)
|
0
|
(1)
|
0
|
(1)
|
0
|
(1)
|
0
|
(1)
|
|
South Dakota
|
U
|
U
|
U
|
U
|
U
|
U
|
U
|
U
|
U
|
U
|
|
Tennessee
|
0.4
|
(28)
|
0.5
|
(33)
|
0.7
|
(46)
|
1.3
|
(83)
|
2
|
(129)
|
|
Texas
|
0.2
|
(59)
|
0.1
|
(36)
|
0.1
|
(35)
|
0.1
|
(37)
|
0.2
|
(44)
|
|
Utah
|
0.4
|
(12)
|
0.2
|
(6)
|
0.4
|
(10)
|
0.4
|
(10)
|
0.6
|
(17)
|
|
Vermont
|
0.2
|
(1)
|
0.2
|
(1)
|
0.3
|
(2)
|
1.0
|
(6)
|
1
|
(6)
|
|
Virginia
|
0.1
|
(8)
|
0.1
|
(10)
|
0.2
|
(13)
|
0.3
|
(25)
|
0.9
|
(76)
|
|
Washington
|
0.4
|
(25)
|
0.3
|
(22)
|
0.4
|
(25)
|
0.6
|
(41)
|
0.8
|
(54)
|
|
West Virginia
|
1.2
|
(22)
|
1.7
|
(31)
|
1.1
|
(21)
|
2.5
|
(46)
|
3
|
(55)
|
|
Wisconsin
|
0.1
|
(3)
|
0.1
|
(3)
|
0.2
|
(10)
|
0.3
|
(15)
|
0.5
|
(26)
|
|
Wyoming
|
0
|
(0)
|
0
|
(0)
|
0
|
(0)
|
0.4
|
(2)
|
U
|
U
|
|
Total
|
0.3
|
(877)
|
0.3
|
(781)
|
0.3
|
(850)
|
0.4
|
(1,229)
|
0.6
|
(1778)
|
*Rate per 100,000 population. †U=No data available for reporting.
Table 4.2 Clinical characteristics of reported cases of acute, hepatitis C* ― United States, 2012
| Clinical characteristic |
Availability of valid data† for clinical characteristic
|
Cases with clinical characteristic§
|
||
|---|---|---|---|---|
|
No.
|
%
|
No.
|
%
|
|
|
Jaundice
|
1,278
|
71.9
|
870
|
68.1
|
|
Hospitalized for hepatitis C
|
1,216
|
68.4
|
675
|
55.5
|
|
Died from hepatitis C
|
1,123
|
63.2
|
6
|
0.5
|
*A total of 1,778 hepatitis C cases were reported during 2012.
†Case reports for which questions regarding clinical characteristics were answered with “yes” or “no.” Reports with any other response were excluded.
§Numbers and percentages represent only those case reports for which data regarding clinical characteristics were available; numbers likely are underestimates.
Table 4.3 Number of laboratory confirmed, hepatitis C (past or present)* case reports† — National Notifiable Diseases Surveillance System (NNDSS), 2012
| Jurisdiction | No. chronic hepatitis C case reports submitted |
|---|---|
|
Colorado
|
2,947
|
|
Connecticut
|
2,934
|
|
Illinois
|
7,673
|
|
Kansas
|
1,805
|
|
Louisiana
|
1,933
|
|
Maine
|
1,213
|
|
Massachusetts
|
7,686
|
|
Michigan
|
8,005
|
|
Montana
|
1,251
|
|
New York
|
6,791
|
|
New York City
|
7,598
|
|
Pennsylvania
|
9,747
|
|
South Carolina
|
3,672
|
|
South Dakota
|
390
|
|
Vermont
|
671
|
|
Wyoming
|
521
|
|
Total
|
64,837
|
* For case-definition, see
http://wwwn.cdc.gov/nndss/script/ConditionList.aspx?Type=0&Yr=2012.
†Reports may not reflect unique cases.
Table 4.4. Number and rate* of deaths with hepatitis C listed as a cause of death†, by demographic characteristic and year — United States, 2007–2011
| Demographic characteristic |
2007
|
2008
|
2009
|
2010
|
2011
|
||||||
|---|---|---|---|---|---|---|---|---|---|---|---|
| No. | Rate | No. | Rate | No. | Rate | No. | Rate | No. | Rate | ||
| Age Group (years) |
0–34 | 131 | 0.09 | 124 | 0.09 | 116 | 0.08 | 117 | 0.08 | 128 | 0.09 |
| 35–44 | 999 | 2.32 | 878 | 2.07 | 828 | 1.99 | 712 | 1.73 | 696 | 1.71 | |
| 45–54 | 5,937 | 13.53 | 5,758 | 12.98 | 5,469 | 12.26 | 5,171 | 11.49 | 5,073 | 11.34 | |
| 55–64 | 5,145 | 15.72 | 5,967 | 17.71 | 6,683 | 19.21 | 7,431 | 20.37 | 8,330 | 21.89 | |
| 65–74 | 1,621 | 8.37 | 1,709 | 8.49 | 1,824 | 8.77 | 1,901 | 8.75 | 2,136 | 9.5 | |
| ≥75 | 1,273 | 6.85 | 1,332 | 7.11 | 1,333 | 7.01 | 1,293 | 6.97 | 1,357 | 7.18 | |
| Race | White§ | 11,798 | 4.31 | 12,261 | 4.37 | 12,682 | 4.43 | ||||
| Black¶ | 2,686 | 7.59 | 2,829 | 7.82 | 2,908 | 7.80 | |||||
| Non-White, non-Black** | 622 | 3.59 | 678 | 3.78 | 663 | 3.61 | |||||
| Race/ Ethnicity |
White, non- Hispanic |
10,575 | 4.03 | 11196 | 4.19 | ||||||
| Black, non- Hispanic |
2,981 | 7.72 | 3167 | 7.89 | |||||||
| Hispanic | 2,318 | 6.83 | 2555 | 7.15 | |||||||
| Asian/ Pacific Islander |
440 | 3.30 | 455 | 3.14 | |||||||
| American Indian/ Alaskan Native |
248 | 9.90 | 275 | 10.61 | |||||||
| Sex | Male | 10,561 | 6.64 | 11,116 | 6.82 | 11,517 | 6.91 | 11,781 | 6.81 | 12,651 | 7.11 |
| Female | 4,545 | 2.65 | 4,652 | 2.65 | 4,736 | 2.65 | 4,846 | 2.63 | 5,070 | 2.7 | |
|
Overall
|
15,106 | 4.58 | 15,768 | 4.66 | 16,235 | 4.70 | 16,627 | 4.65 | 17,721 | 4.82 | |
* Rates for race, sex, and overall total are age-adjusted per 100,000 U.S. standard population.
†Cause of death is defined as the underlying cause of death or one of the multiple causes of death and is based on the International Classification of Diseases, 10th Revision (ICD-10) codes B17.1 and B18.2 (hepatitis C).
§Included white, non-Hispanic and white Hispanic.
¶Included black, non-Hispanic and black Hispanic.
**Included all other racial/ethnic groups.
Source: CDC. National Vital Statistics System.
Downloads of this slide: PDF PowerPoint
Downloads of this slide: PDF PowerPoint
Downloads of this slide: PDF PowerPoint
Downloads of this slide: PDF PowerPoint
Downloads of this slide: PDF PowerPoint
Downloads of this slide: PDF PowerPoint
Downloads of this slide: PDF PowerPoint
All seven figure slides in PowerPoint 2007 format [PPTX – 407 KB]
- Page last reviewed: August 26, 2014
- Page last updated: August 26, 2014
- Content source: