

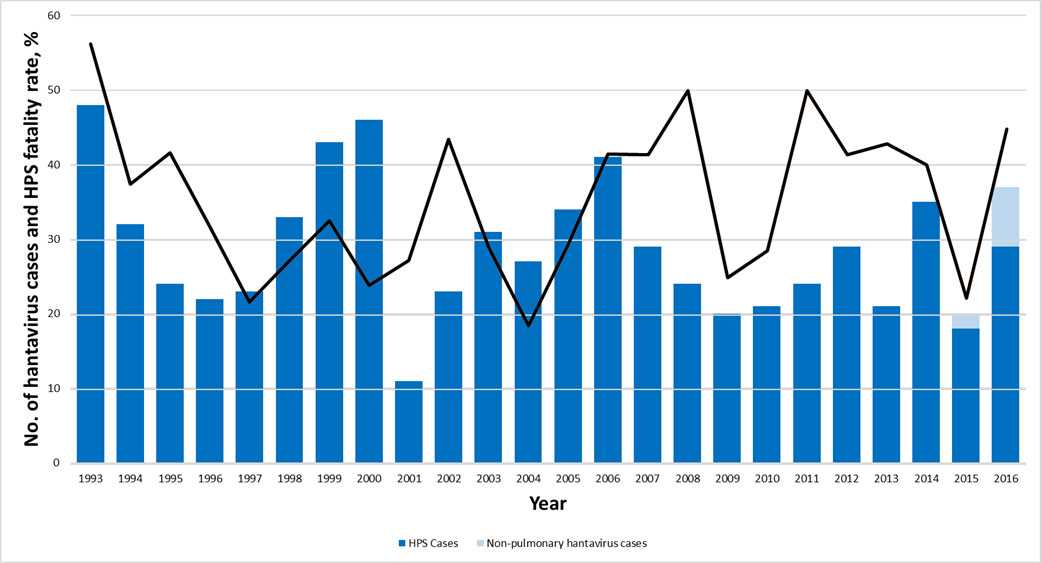
Annual U.S. Hantavirus Disease and HPS Case Fatality, 1993-2016
 ShareCompartir
| Year | HPS Cases | Fatal HPS Cases | HPS Case Fatality | Non-pulmonary hantavirus cases | Fatal Non-pulmonary hantavirus cases |
|---|---|---|---|---|---|
| 1993 | 48 | 27 | 56% | * | * |
| 1994 | 32 | 12 | 38% | * | * |
| 1995 | 24 | 10 | 42% | * | * |
| 1996 | 22 | 7 | 32% | * | * |
| 1997 | 23 | 5 | 22% | * | * |
| 1998 | 33 | 9 | 27% | * | * |
| 1999 | 43 | 14 | 33% | * | * |
| 2000 | 46 | 11 | 24% | * | * |
| 2001 | 11 | 3 | 27% | * | * |
| 2002 | 23 | 10 | 43% | * | * |
| 2003 | 31 | 9 | 29% | * | * |
| 2004 | 27 | 5 | 19% | * | * |
| 2005 | 34 | 10 | 29% | * | * |
| 2006 | 41 | 17 | 41% | * | * |
| 2007 | 29 | 12 | 41% | * | * |
| 2008 | 24 | 12 | 50% | * | * |
| 2009 | 20 | 5 | 25% | * | * |
| 2010 | 21 | 6 | 29% | * | * |
| 2011 | 24 | 12 | 50% | * | * |
| 2012 | 29 | 12 | 41% | * | * |
| 2013 | 21 | 9 | 43% | * | * |
| 2014 | 35 | 14 | 40% | * | * |
| 2015 | 18 | 4 | 22% | 2 | 0 |
| 2016 | 29 | 13 | 45% | 8 | 0 |
| Total | 688 | 248 | 36% | 10 | 0 |
* Surveillance and reporting of non-pulmonary cases began in 2015. Non-pulmonary hantavirus disease includes infections of Sin Nombre virus and Seoul virus, among other hantavirus species.
- Page last reviewed: September 13, 2017
- Page last updated: September 13, 2017
- Content source: