

Map Details - Rates of Adults and Adolescents Living with Diagnosed HIV Infection by Area of Residence, Year-end 2013
 ShareCompartir
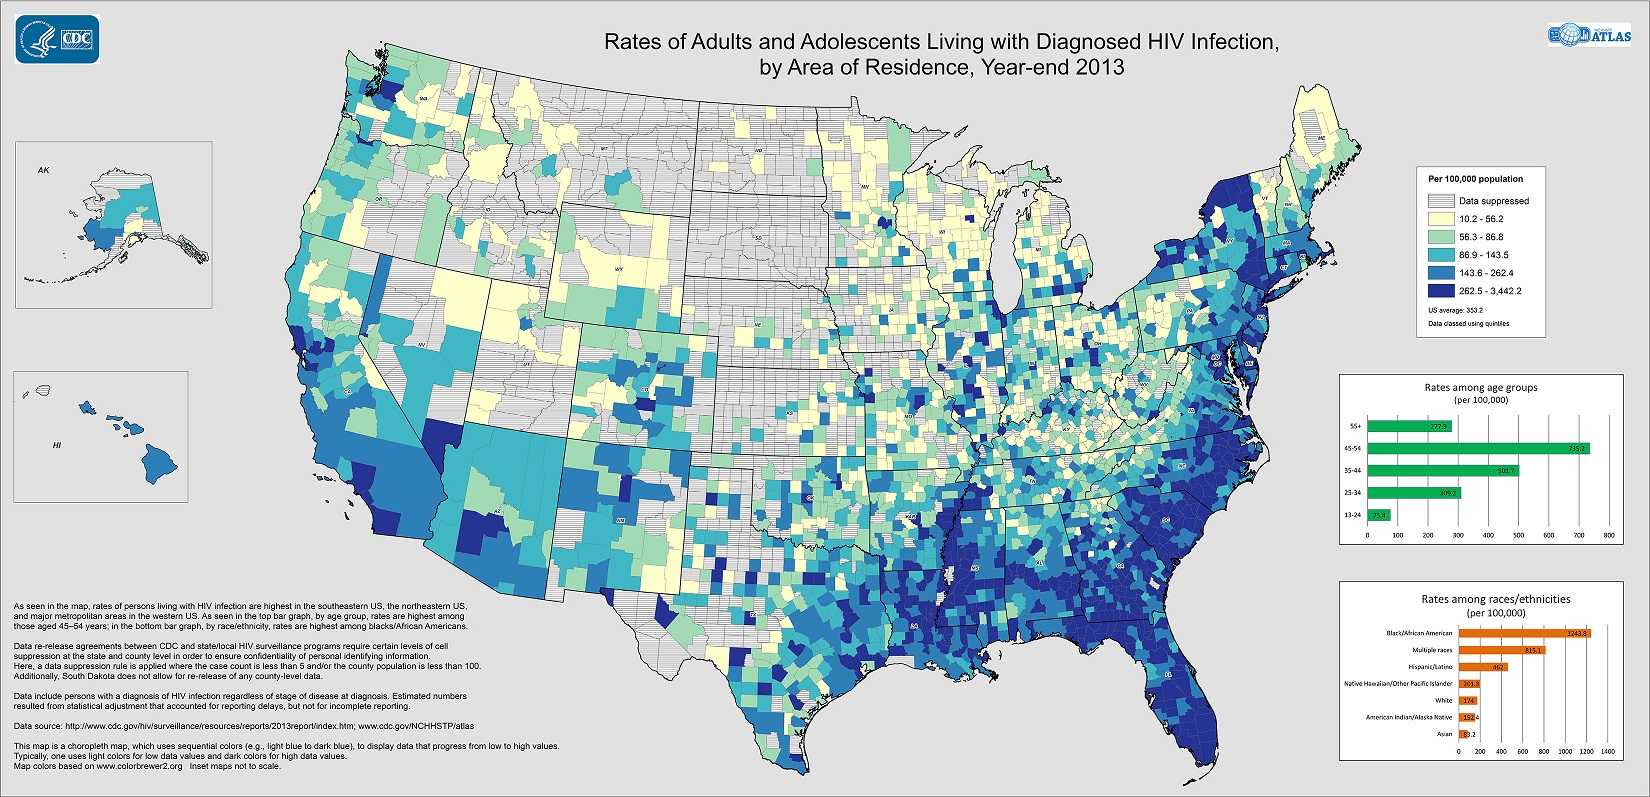
Rates of Adults and Adolescents Living with Diagnosed HIV Infection by Area of Residence, Year-end 2013
Description
As seen in the map, rates of persons living with HIV infection are highest in the southeastern US, the northeastern US, and major metropolitan areas in the western US. As seen in the top bar graph, by age group, rates are highest among those aged 45–54 years; in the bottom bar graph, by race/ethnicity, rates are highest among blacks/African Americans.
Software used:
Other (website)
Data sources:
Dec 2015
Key words:
HIV, HIV infection
Location:
USA
Health Issue:
HIV/AIDS, Hepatitis, STD, and TB prevention
Author / Contact Information:
Kim Elmore, OID/NCHHSTP/DHAP/QSDMB
Citation:
www.cdc.gov/NCHHSTP/atlas
- Page last reviewed: April 12, 2016
- Page last updated: April 12, 2016
- Content source: