

GIS at CDC
 ShareCompartir
Find out more about how the following groups at CDC use GIS, geography, and geospatial science in their work.
Agency for Toxic Substances and Disease Registry (ATSDR)/Centers for Disease Control and Prevention - Geospatial Research, Analysis, and Services Program (GRASP)
Geospatial Research, Analysis, and Services Program (GRASP)
The Geospatial Research, Analysis, and Services Program (GRASP) is the only group at CDC dedicated exclusively to applying geospatial science, technology, and visualization to public health problems. GRASP collaborates with partners across CDC/ATSDR and studies patterns associated with environmental health, infectious and chronic disease, public health emergencies, and injury. GRASP provides scientific guidance and technical expertise to strengthen disease surveillance, examine disease risk factors, plan and evaluate interventions, and produce interactive mapping applications. GRASP also offers training and resources to build agency-wide capacity. In addition to collaborative efforts, GRASP internal products focus on analysis and visualization of complex datasets and include the Social Vulnerability Index (SVI), and the Intro Map Series for hazardous waste sites.
For more information, visit http://www.atsdr.cdc.gov/dthhs/office_of_director/grasp.html.
National Center for Chronic Disease Prevention and Health Promotion (NCCDPHP) - Division of Diabetes Translation
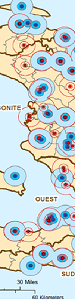
 The Division of Diabetes Translation uses geographic information system mapping in the surveillance of diabetes and its related risk factors and outcomes. In the United States Diabetes Surveillance System (USDSS), both state and county-level surveillance data are displayed in an online, interactive atlas that allows users to view geographic patterns and examine trends over time across the United States and within states. Most state estimates are calculated using data from the Behavioral Risk Factor Surveillance System (BRFSS), and county-level estimates are created by applying Bayesian multilevel modeling techniques to BRFSS data. In addition, the USDSS includes national estimates that are derived from a variety of data sources.
National Center for Chronic Disease Prevention and Health Promotion (NCCDPHP) - Division for Heart Disease and Stroke Prevention
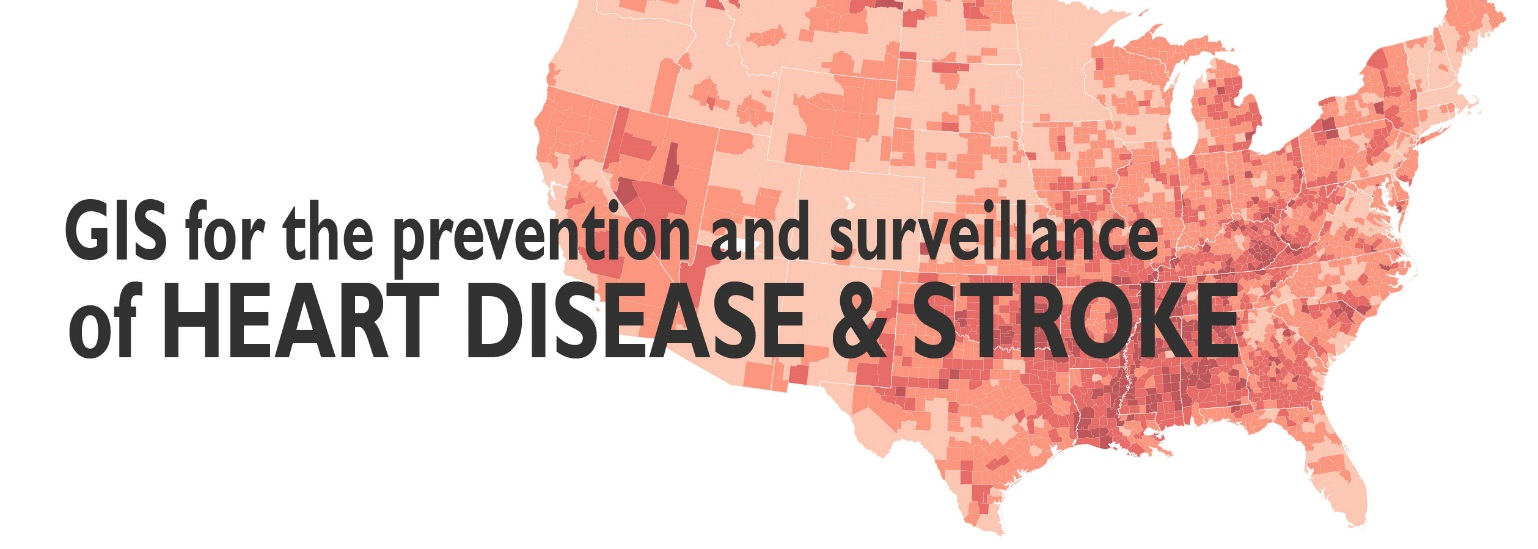
The Division for Heart Disease and Stroke Prevention applies GIS and Geospatial Science for the surveillance and documentation of the geographic components of heart disease, stroke, and their risk factors. The Division provides national maps and the Interactive Atlas of Heart Disease and Stroke to document heart disease, stroke, and the social determinants of health related to those outcomes. In addition, the Division manages the Chronic Disease GIS Exchange, a website dedicated to exploring and sharing resources and maps used to inform chronic disease prevention programs and policies. They fund state and local health departments to learn the use of GIS through the GIS Capacity Building among State and Local Health Departments project. They also use geospatial science to conduct spatial and spatiotemporal studies of heart disease and stroke morbidity, mortality and their correlates.
For more information, visit http://www.cdc.gov/dhdsp/maps/.
National Center for Chronic Disease Prevention and Health Promotion (NCCDPHP) - Division of Population Health
Analytic Methods Team
The Division of Population Health’s Analytic Methods Team is composed of four geographers, one statistician, and three epidemiologists whose main goal is the development and application of geospatial and statistical methods for chronic disease epidemiology. The team utilizes a variety of techniques and tools, including small-area estimation, spatial accessibility and quantification, multilevel analysis, Bayesian disease mapping, spatial statistics, spatial analysis, and geographic information systems. The team focuses on chronic disease risk factors and population health outcomes but also works collaboratively with other programs throughout CDC.
Recent and current research includes:
- Geographic accessibility to established drinking places in the US
- Population-based geographic access to health care specialists
- Explanations for geographic variation in sleep duration
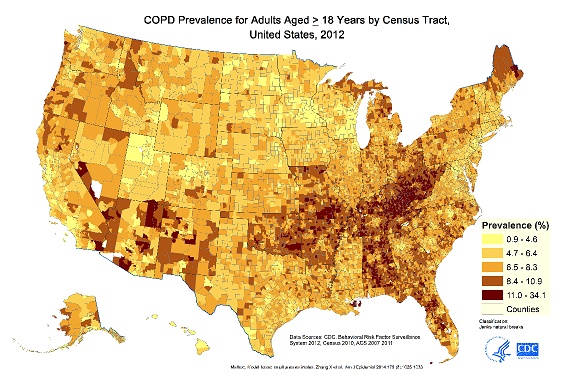
- Explanations for geographic variation in COPD prevalence
- County-level variations in multiple chronic conditions among Medicare beneficiaries
- Impact of changes in alcohol outlet density and violent crime in Buckhead (Atlanta, GA)
- Association between airport noise exposure and self-reported sleep insufficiency
- Small-area estimation
The team recently received a two-year grant from the Robert Wood Johnson Foundation, via the CDC Foundation, to produce census tract-level small-area estimates of the leading chronic diseases and associated risk factors and preventive health services for the 500 largest US cities.
Contact: James B. Holt, MPA, PhD jgh4@cdc.gov or 770-488-5510.
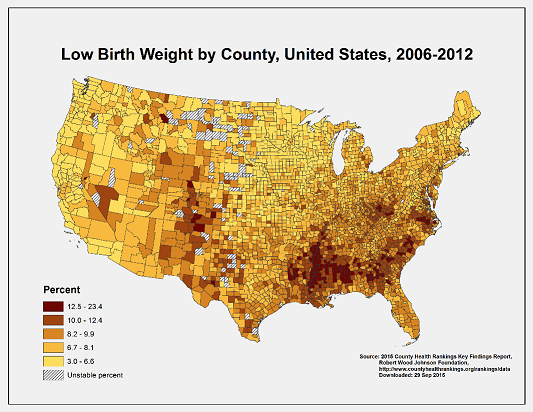
National Center for Chronic Disease Prevention and Health Promotion (NCCDPHP) - Division of Reproductive Health
CDC’s Division of Reproductive Health (DRH) focuses on issues related to reproductive, maternal, and infant health. DRH is dedicated to improving the lives of women, children, and families through research, public health monitoring, scientific assistance, and partnerships. Activities and programs—addressing topics from infant mortality to post-partum depression—provide support to organizations, institutions, providers, and consumers across the United States and around the world.
A key component of DRH’s work is collecting and analyzing a vast collection of reproductive, maternal and infant health-related data. DRH scientists incorporate geostatistical methodologies and map visualizations into their research, planning, and applied science studies from the beginning to investigate and envision the geographic aspects of this data.
For more information about DRH, visit http://www.cdc.gov/reproductivehealth/index.html.
National Center for Immunization and Respiratory Diseases (NCIRD) - Division of Bacterial Diseases (DBD)
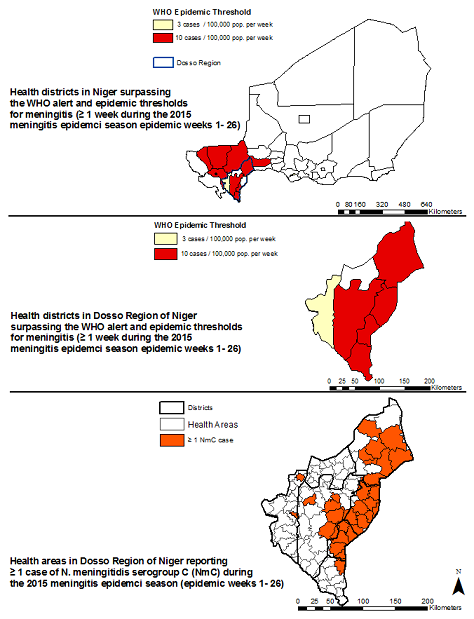 GIS for monitoring the spatial spread of meningitis outbreaks and assessing spatio-temporal relationships of Neisseria meningitidis and climate factors
The Division of Bacterial Diseases routinely applies GIS mapping to monitor the spatial spread of meningitis outbreaks at district and sub-district levels in the Meningitis Belt of Africa to inform outbreak response strategies, specifically to identify resources (e.g., communicate affected regions and needs to decision makers) and coordinate with international partners. The Division leads the MenAfriNet consortium which supports Ministries of Health to integrate GIS capacity into routine surveillance to strengthen epidemic detection and response. The Division in collaboration with the Centre de Recherche Médicale et Sanitaire, the Niger Ministry of Health, and the National Oceanic and Atmospheric Administration uses geospatial science to understand the epidemiological, spatial and temporal characteristics of an emerging epidemic strain of Neisseria meningitidis serogroup C as well as its relationship between its incidence and climate factors in the Dosso region of Niger at the sub-district (health area) level from 2002 to 2015. This work will contribute to improved efficiency of detection and response to meningitis epidemics, and inform targeting of reactive vaccination campaigns.
Division of Global Migration and Quarantine
The Travelers’ Health Branch in DGMQ uses GIS and maps in many ways to inform travelers and clinicians of diseases of importance to international travel. One of the major uses of maps is for the Yellow Book. The CDC Health Information for International Travel, better known as “The Yellow Book,” has been a trusted resource for travel health information since 1967. It is published every 2 years, and with each new edition new maps are designed and produced. The book is meant to inform travel health clinicians about the latest health recommendations about various diseases and health risks. For the latest edition, maps were made using ArcGIS Desktop Advanced 10.2 with Spatial Analyst Extension; Adobe Photoshop and Adobe Illustrator.
The 2016 Yellow Book contains 60 maps:
- 17 global or continental disease maps
- 15 country specific malaria maps
- 10 country specific yellow fever maps
- 18 destination maps
Link to the Travelers Health page: http://wwwnc.cdc.gov/travel/.
Link to the online Yellow Book maps: http://wwwnc.cdc.gov/travel/yellowbook/2016/list/maps.
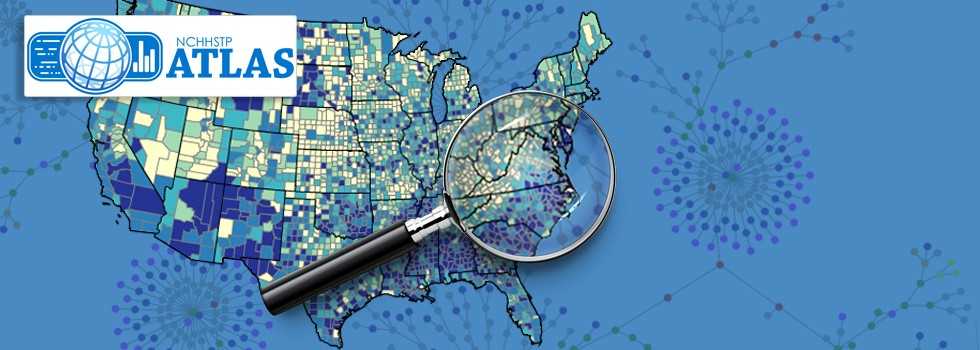
National Center for HIV/AIDS, Viral Hepatitis, STD, and TB Prevention (NCHHSTP)
The National Center for HIV/AIDS, Viral Hepatitis, STD, and TB Prevention (NCHHSTP) Atlas is the one-stop shop for CDC’s most recent surveillance data on HIV, viral hepatitis, STDs, and TB, as well as 10 years of the most essential CDC data for these diseases at the national, state, and county levels, and by populations.
In the Division of HIV/AIDS Prevention, the Geocoding and Data Linkage (GDL) Activity is a part of PS13-1302 funding cycle for jurisdictions in the HIV Incidence and Case Surveillance Branch (HICSB). The purpose of GDL is to enable areas to capture, store, analyze, and display data. Geocoded HIV data can be spatially linked to other data sources to enhance understanding of social determinants of health (SDH) affecting communities impacted by HIV.
In the Division of STD Prevention, the SSuN Project, established in 2005, is currently in the 3rd cycle of funding under PS13-1306. The purpose of the STD Surveillance Network (SSuN) is to provide behavioral, demographic and clinical information on gonorrhea cases reported to state/local health departments, to provide information on patients presenting for care in STD and family planning clinical settings, and to explore evolving health information technologies to improve STD surveillance nationwide. Through this combination of collaborative activities, SSuN provides uniform, comprehensive information on a representative sample of STD cases, and provides health departments with STD-related health care trend information not currently available from any other source.
For questions or more information, please contact the GeoSWG Executive Committee at geoswg@cdc.gov.
- Page last reviewed: June 17, 2016
- Page last updated: June 17, 2016
- Content source: