The Influenza Vaccination Coverage in Long-term Care Settings
What is the current influenza vaccination coverage rate among health care personnel (HCP)?
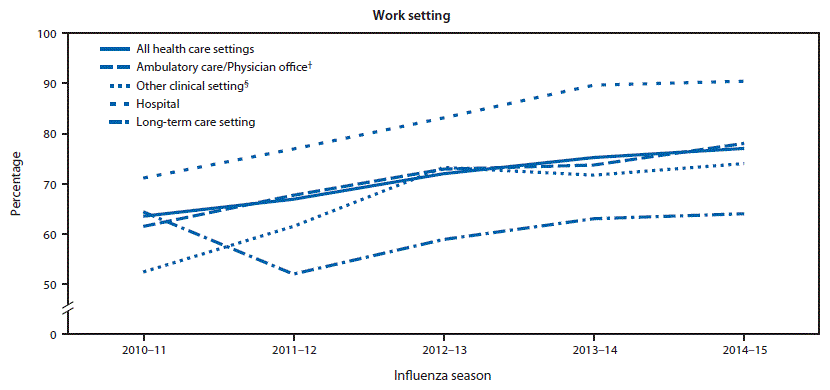
As reported in the September 18, 2015 Morbidity and Mortality Weekly Report (MMWR), overall, 79.0% of HCP reported having received an influenza vaccination for the 2015-16 season, similar to the 77.3% coverage among HCP reported for the 2014–15 season. Vaccination coverage was highest among HCP working in hospitals (91.2%) and lowest among HCP working in long-term care settings (69.2%). Since the 2010-11 influenza season, HCP in LTC settings continue to have the lowest reported influenza vaccination rates among all HCP. In comparison, the Healthy People 2020 annual target goal for influenza vaccination among health care personnel is 90 percent (see Healthy People 2020 objective IID-12.9). **
** The methods used in the Internet panel survey differ from those of the NHIS; thus, results from the Internet panel survey should not be directly compared to the Healthy People 2020 target.
FIGURE. Percentage of health care personnel* (HCP) who reported receiving influenza vaccination, by work setting and occupation type — Internet panel surveys, United States, 2010–11 through 2014–15 influenza seasons

To estimate influenza vaccination coverage among U.S. HCP for the 2014–15 influenza season, CDC conducted an opt-in Internet panel survey of 1,914 HCP during March 31–April 15, 2015. While overall HCP flu vaccination for the 2014-15 season was similar to coverage in the 2013-14 season, coverage was higher in 2014–15 compared to the 2013-14 season among pharmacists (95.3% versus 85.7%), assistants/aides (64.4% versus 57.7%), and nonclinical personnel (75.2% versus 68.6%). Coverage among other clinical personnel decreased from 87.4% in 2013–14 to 81.3% in 2014–15. Coverage for other occupation types was similar in both seasons. For more information on influenza vaccination coverage and key findings related to employer requirements or recommendations, visit Influenza Vaccination Coverage Among Health Care Personnel, Opt-In Internet Panel Survey, United States, 2014-2015 Influenza Season.
Additional information is located at CDC’s FluVaxView Influenza Vaccination Coverage site and the CDC’s Influenza Vaccination Information for Health Care Workers.
- Page last reviewed: September 6, 2016
- Page last updated: September 6, 2016
- Content source:
- Centers for Disease Control and Prevention, National Center for Immunization and Respiratory Diseases (NCIRD)
- Page maintained by: Office of the Associate Director for Communication, Digital Media Branch, Division of Public Affairs


 ShareCompartir