

Hospital Lab Trends
 ShareCompartir
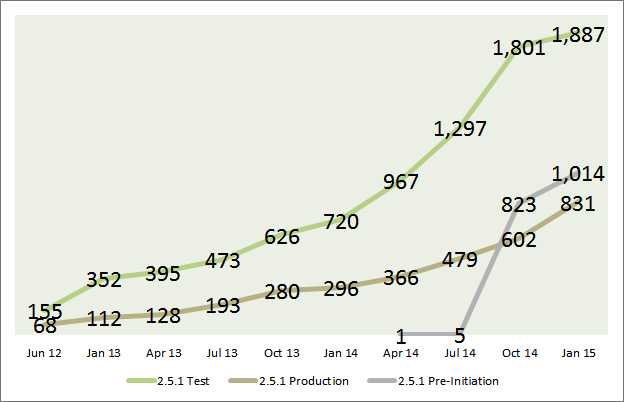
Number of Hospitals in Test and Production for 2.5.1 ELR, Trend over Time.
Between January 2014 and January 2015, the number of hospital labs testing the 2.5.1 format ELR needed for ELR Meaningful Use more than doubled, and the number of hospital labs with production 2.5.1 ELR almost tripled, increasing to 281% of the 2014 number.
The number of hospital labs in test and production for ELR has grown every quarter since June 2012, as shown in the following graph.
Most hospital labs do not process as much volume as large national labs or public health labs. However, there are more than 6 times as many hospital labs in the U.S. than there are large national labs and public health labs combined; therefore, the total lab reporting volume from all hospitals is still high, with opportunities for further growth.
In 2013, hospital labs were responsible for 20% of electronic lab reports to public health for notifiable diseases. This compares to 14% in 2012.
Trends for All Labs
In addition to hospital labs, the CDC monitors ELR for four additional lab types, for a total of five types of labs:
- Federal Labs
- Hospital Labs
- Large Labs
- Public Health Labs
- Other Labs
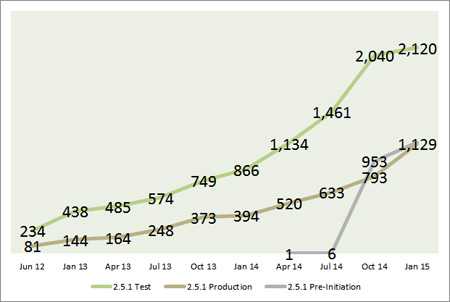
Number of Labs of All Types in Test and Production for 2.5.1 ELR, Trend over Time.
The total numbers of labs of all types in test and production for 2.5.1 ELR are growing at rates generally consistent with those of hospital labs alone, although for all labs the production increase is a higher percentage change than the test increase. The biggest gains to date are during the 2014 calendar year:
- Page last reviewed: August 14, 2015
- Page last updated: August 14, 2015
- Content source: