

ELR Meaningful Use
 ShareCompartir
The Centers for Medicare & Medicaid Services’ (CMS) Medicare and Medicaid Electronic Health Records (EHR) Incentive Program (also known as Meaningful Use) provides incentive payments to eligible providers and eligible hospitals who meet identified targets as they adopt, implement, upgrade or demonstrate use of certified EHR technology. Primary goals of Meaningful Use are to improve clinical patient care and increase administrative efficiency. Meaningful use is administered by the Centers for Medicare and Medicaid Services CMS and the Office of the National Coordinator for Health Information Technology (ONC).
Currently, the ELR public health objectives of Meaningful Use only apply to Eligible Hospitals and Critical Access Hospitals (not to doctors or other eligible providers). Other public health objectives apply to both eligible hospitals and eligible providers, or to just eligible providers.
Meaningful Use is divided into three stages. Eligible hospitals must demonstrate Stage 1 Meaningful Use before moving to Stage 2 Meaningful Use. There are three types of measures that must be met by eligible hospitals for Meaningful Use: core objectives, menu set objectives and Clinical Quality Measures (CQMs).
- Core objectives are required. There are 11 core objectives for Stage 1 and 16 core objectives for Stage 2. For Stage 2, ELR is core objective 14 [PDF 3 pages].
- Menu set objectives are selected from a list of possible options. For Stage 1, 5 menu options are selected from a list of 10, for a total of 16 core and menu objectives. For Stage 2, 3 menu options are selected from a list of 6, for a total of 19 core and menu objectives. For Stage 1, ELR is menu objective 9 [PDF – 3 pages].
- For more information about core and menu set objectives, see the Stage 1 overview page, Stage 1 objectives sheet [PDF – 2 pages], Stage 2 objectives sheet [PDF – 2 pages, and Stage 2 tip sheet [PDF – 9 pages from CMS.
- Clinical Quality Measures. Clinical quality measures are subdivided into core measures, alternate core measures, and additional measures. See the CMS website for more information.
Public Health objectives, which include immunization reporting, reportable lab results to public health agencies, syndromic surveillance, cancer registry reporting, and specialized registries, are included as menu set objectives in Stage 1 and core objectives in Stage 2.
The Stage 1, meaningful use objective and measure for reportable lab results are:
- Objective: Capability to submit electronic data on reportable (as required by State or local law) lab results to public health agencies and actual submission according to applicable law and practice.
- Measure: Performed at least one test of certified EHR technology’s capacity to provide electronic submission of reportable lab results to public health agencies and follow-up submission if the test is successful (unless none of the public health agencies to which an eligible hospital or CAH submits such information has the capacity to receive the information electronically), except where prohibited.
- For more information, refer to the CMS Stage 1 Eligible Hospital Reportable Lab Results Specification Sheet [PDF – 3 pages]
The Stage 2, meaningful use objective and measure for reportable lab results are:
- Objective: Capability to submit electronic reportable laboratory results to public health agencies, where except where prohibited, and in accordance with applicable law and practice.
- Measure: Successful ongoing submission of electronic reportable laboratory results from Certified EHR Technology to a public health agency for the entire EHR reporting period.
- For more information, refer to the CMS Stage 2 Eligible Hospital Reportable Lab Results Specification Sheet [PDF – 3 pages]
For links to technical standards and formats for implementing ELR, access the CDC ELR Technical Standards page.
Read more about Meaningful Use and the other public health objectives on the CDC Meaningful Use site.
HL7 Messages
ELR that qualifies for Meaningful Use menu objectives (Stage 1) or core objectives (Stage 2) must follow message specifications set and maintained by Health Level Seven International (HL7), an international standards organization. For a complete list of technology standards for Meaningful Use, access the HealtIT.gov Standards Hub.
Individual states and territories legislate exactly which HL7 fields are required within their jurisdiction. Some jurisdictions are exempt from ELR reporting altogether and can certify for Meaningful Use without it. Thus, it is important to understand the laws governing laboratory reporting for reportable diseases and ELR for your state or territory (including which facilities are responsible for reporting), as well as national and international standards.
Electronic laboratory reporting to public health agencies is specified in the 2.3.1 [PDF 87 pages] HL7 ELR standard, which was approved in 1999. The expanded 2.5.1 HL7 ELR standard was adopted in 2009. Among other changes, the 2.5.1 standard includes additional fields to specify the performing laboratory, which are needed to fulfill CLIA requirements. Read more from the HIT Standards Committee’s Surveillance Implementation Guide Power Team [PDF 3 pages].
Commercial tools are available that translate 2.3.1 messages into 2.5.1. messages (or 2.5.1 messages into 2.3.1 messages). Thus, the message version that is transmitted can be manipulated before sending. However, if fields from the 2.5.1 expanded standard are required by a state or territory, or for Meaningful Use, then merely upgrading a 2.3.1 message to a 2.5.1 message format will not fulfill the requirements. The National Institute of Standards and Technology (NIST) tool can be used to validate 2.5.1 messages.
Electronic laboratory reports to public health submitted as part of a hospital’s Meaningful Use incentive certification effort must be formatted using the HL7 2.5.1 format.
NOTE: Only the 2.5.1 version of the Electronic Laboratory Reporting HL7 standard supports Meaningful Use certification. The 2.3.1 standard qualifies as ELR, but it does not fulfill public health reporting requirements for Stage 1 or Stage 2 of Meaningful Use.
In 2013, 90% of electronic laboratory reports were transmitted as HL7 formatted messages (including both 2.3.1 and 2.5.1 message versions); 29% of HL7 messages were 2.5.1 messages, meeting Meaningful Use criteria.
ELR is monitored for 10 disease categories. The following table shows the percentage of HL7 formatted electronic laboratory reports (including both 2.3.1 and 2.5.1 messages) versus overall electronic laboratory reports for the 10 disease categories in 2013.
HL7 ELR as a Percentage of Total ELR by Disease Category
2013 Calendar Year Data
| Disease Categories | Total HL7 ELR | Total ELR | HL7 % of Total ELR |
|---|---|---|---|
| Enteric | 197,288 | 213,675 | 92 |
| General Communicable | 402,726 | 431,072 | 93 |
| Hepatitis | 1,666,717 | 1,807,536 | 92 |
| HIV | 3,484,617 | 3,815,457 | 91 |
| Influenza | 239,087 | 270,098 | 89 |
| Lead/Toxic | 2,845,886 | 3,544,711 | 80 |
| STD | 3,500,763 | 3,700,077 | 95 |
| TB/Myco | 253,310 | 264,008 | 96 |
| VPD | 176,995 | 185,537 | 95 |
| Zoonotic | 384,428 | 422,252 | 91 |
| All Categories | 13,151,817 | 14,654,423 | 90 |
HL7 ELR as a Percentage of Total ELR by Disease Category
Non-HL7 ELR includes proprietary ETL (Extract, Transform, and Load) formats, as well as web entry of laboratory reports for public health performed at laboratory sites.
HL7 2.5.1 ELR Compared to HL7 ELR and All ELR
In calendar year 2013, the volume of HL7 2.5.1 messages increased:
- 2.5.1 volume rose as a percentage of HL7 volume from 22 % in 2012 to 29%.
- 2.5.1 volume rose as a percentage of ELR from 20 % in 2012 to 26%.
- 2.5.1 volume rose as a percentage of all laboratory reports from 12% in 2012 to 17%.
- More public health departments received at least some of their ELR in the 2.5.1 format. Only 28 jurisdictions received no ELR in the 2.5.1 format, compared to 35 jurisdictions without any ELR in the 2.5.1 format in 2012.
- The number of jurisdictions sending more than 10% of their ELR as 2.5.1 messages rose from 9 to 15.
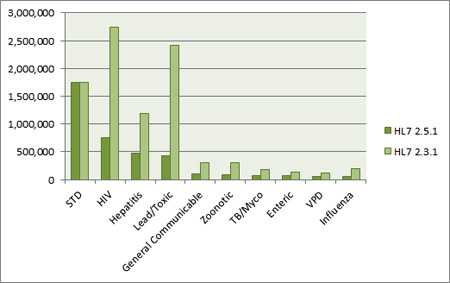
2.5.1 Volume versus 2.3.1 Volume by Disease Categories, Calendar Year 2013.
Currently, more HL7 ELR is sent in the 2.3.1 format than in the 2.5.1 format. In 2013, 71% of HL7 formatted electronic laboratory reports to public health were 2.3.1 messages, and 29% were 2.5.1 messages. The STD disease category had roughly a 50/50 split, while other disease categories weighed more heavily toward 2.3.1 volume.
Hospital Progress in 2014
Financial incentives from Meaningful Use are a catalyst for ELR adoption by eligible hospitals. From January 2014 to January 2015, the number of hospitals in production for 2.5.1 HL7 messaging almost tripled, and the hospitals in test more than doubled:
Hospitals in Test and Production, HL7 2.5.1 ELR
| Jan 2014 | Jan 2015 | 2015 Compared to 2014 | |
|---|---|---|---|
| Hospitals in Production | 296 | 831 | 281% difference |
| Hospitals in Test (includes pre-testing and acceptance testing) |
720 | 1,887 | 262% difference |
| Pre-Initiation Hospitals (registered or in queue, not yet testing) |
* not documented | 1,014 | — — |
Comparison of Laboratory, ELR, HL7, and 2.5.1 Volume
This section compares the overall laboratory reporting volume with the electronic laboratory reporting volume, HL7 volume, and 2.5.1 volume in 2012 and 2013.
All volume numbers have increased, as well as the percentages of ELR, HL7, and 2.5.1 compared to total laboratory volume.
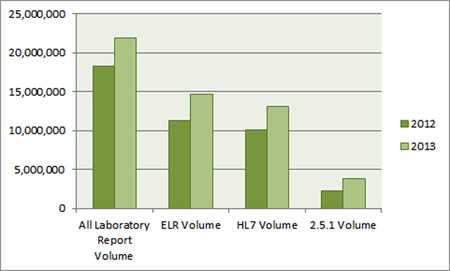
All Reports, Electronic Reports, HL7 Reports, and HL7 2.5.1 Reports.
2.5.1 volume is a subset of total HL7 volume, which is a subset of total ELR volume, which is a subset of total laboratory report volume. For 2013:
- ELR Volume is 67 percent of all laboratory volume
- HL7 volume is 60 percent of all laboratory volume, and
- 2.5.1 volume is 17 percent of all laboratory volume
All Reports, Electronic Reports, HL7 Reports, and 2.5.1 HL7 Reports: Table of Volumes and Percentages
| Year | All Laboratory Report Volume |
ELR | HL7 | 2.5.1 |
|---|---|---|---|---|
| 2013 | 21,850,802 | 14,654,423 ———— 67% of all laboratory volume |
13,151,817 ———— 60 % of all laboratory volume |
3,823,407 ———— 17 % of all laboratory volume |
| 2012 | 18,261,876 | 11,328,935 ———— 62 % of all laboratory volume |
10,070,436 ———— 55 % of all laboratory volume |
2,216,152 ———— 12 % of all laboratory volume |
To request an addition or change to this page, contact elr@cdc.gov.
- Page last reviewed: August 14, 2015
- Page last updated: August 14, 2015
- Content source: