

ELR Percentages by Disease Category
 ShareCompartir
ELR is monitored against 10 disease categories. In 2013, across all jurisdictions, the Hepatitis, HIV, and Zoonotic disease categories showed the biggest gains in the percentage of lab reports being sent electronically (Hepatitis +13%, HIV +12%, and Zoonotic +8%).
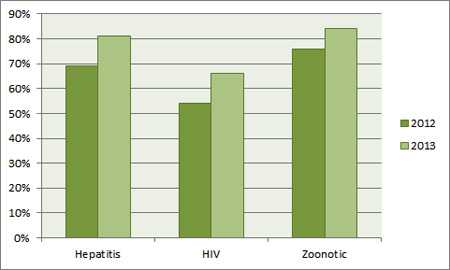
Increased Percentages of ELR for Hepatitis, HIV, and Zoonotic in 2013.
Increased Percentages of ELR for Hepatitis, HIV, and Zoonotic in 2013
This bar graph shows changes to the percentage of ELR for Hepatitis, HIV, and Zoonotic from 2012 to 2013. Hepatitis was 69 percent in 2012 and 81 percent in 2013. HIV was 54 percent in 2012 and 66 percent in 2013. Zoonotic was 76 percent in 2012 and 84 percent in 2013.}
| Disease Category | Laboratory Reports (Percentage of Total Laboratory Reports) | ||
|---|---|---|---|
| 2012 | 2013 | Gain/Loss | |
| Hepatitis | 69 | 81 | 13 |
| HIV | 54 | 66 | 12 |
| Zoonotic | 76 | 84 | 8 |
| TB/Myco | 34 | 39 | 5 |
| Enteric | 57 | 61 | 4 |
| Influenza | 68 | 71 | 2 |
| STD | 63 | 65 | 2 |
| Lead/Toxic | 65 | 66 | 2 |
| VPD | 72 | 66 | -6 |
| General Communicable | 85 | 65 | -20 |
| Totals, Average Percentage | 62 | 67 | 5 |
In 2012, General Communicable, Zoonotic, and VPD had 70% or more of their reports sent electronically (General Communicable 85%, Zoonotic 76%, VPD 72%), and in 2013, Zoonotic, Hepatitis, and Influenza had 70% or more of their reports sent electronically (Zoonotic 84%, Hepatitis 81%, Influenza 71%).
The total number of all lab reports (both electronic and paper/fax) sent in 2013 was higher than the number sent in 2012 (21.9 million compared to 18.3 million), and a higher percentage of these reports were sent electronically. Overall, there was a 5% increase in ELR volume as a percentage of laboratory reporting volume for the year.
The following table shows electronic laboratory reporting for 2012 and 2013 subdivided into disease category percentages. In both 2012 and 2013, HIV, STD, and Lead/Toxic were each responsible for roughly a quarter of the electronic laboratory reporting volume; seven other disease categories made up the remaining 25% of electronic reports for those years.
| Disease Category | Percentage of Total Electronic Laboratory Reports (Per Disease Category) | |
|---|---|---|
| 2012 | 2013 | |
| HIV | 23 | 26 |
| STD | 25 | 25 |
| Lead/Toxic | 24 | 24 |
| Hepatitis | 13 | 12 |
| General Communicable | 5 | 3 |
| Zoonotic | 3 | 3 |
| Influenza | 2 | 2 |
| TB/Myco | 2 | 2 |
| Enteric | 2 | 1 |
| VPD | 2 | 1 |
| Total ELR Volume | 100 | 100 |
ELR in 2013 Subdivided Into Disease Categories
This graph shows the disease category percentages contributing to electronic laboratory reporting volume for 2013:
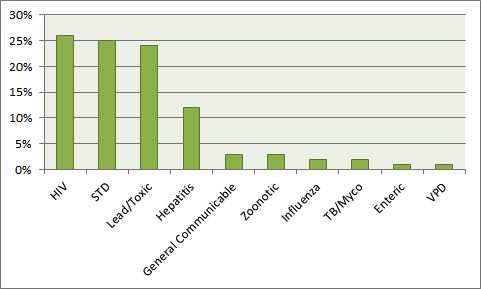
ELR in 2013 Subdivided Into Disease Categories.
- Page last reviewed: August 14, 2015
- Page last updated: August 14, 2015
- Content source: