

Map Details - Montana Stroke Mortality Rates by County
 ShareCompartir
Impact Statement
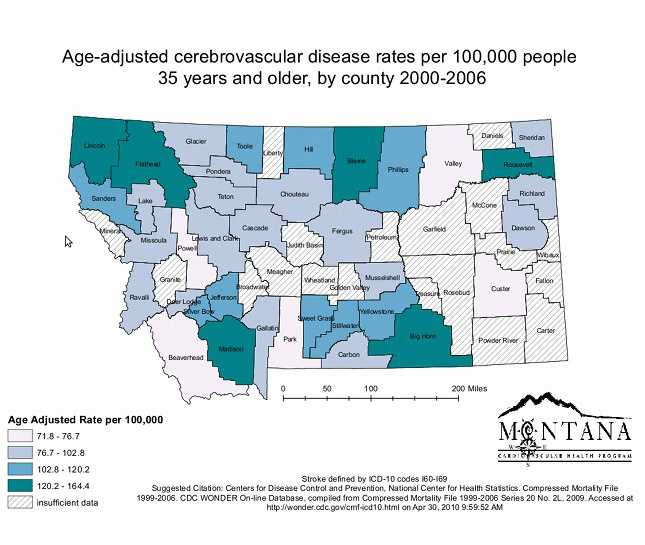
This map illustrates Montana’s age-adjusted stroke mortality rates over a 7-year time-period (2000-2006). It is apparent, from the map, that many counties (especially in central and southeast Montana) had less than 20 stroke deaths, and county level data had to be suppressed. It appears that certain areas, which cover several adjacent counties, have high stroke mortality rates.
Findings
As of December 2010, the 14 PSCs in Minnesota were in the Twin Cities Metropolitan Area or in Rochester; 5 additional PSCs were in border locations of neighboring states. Population clusters in the major cities (Duluth, St. Cloud, and Mankato) and the many regional towns of outstate Minnesota are visible both within and outside the 60-minute drive time polygons to a PSC. Additional maps in this series show the distribution of population by race, ethnicity, and age. Additional maps highlighting access to hospitals with specific capacities, such as the presence of a stroke team in the ED, access to telemedicine consults, the presence of stroke unit care, and rehabilitation services, will further inform this planning process.
Software Used
ArcGIS 9.3
Data Used
National Center for Health Statistics mortality data provided at the May 2010 training.
Methods Used
Statistical methods, age-adjusted to the US 2000 population.
Contact the Submitter of this Map
Carrie Oser, Epidemiologist/Evaluator, Montana DPHHS
(406) 444-4002
coser@mt.gov
How to Cite this Map
Age-adjusted stroke mortality rates per 100,000 people 35 years and older, by county, Montana, 2000-2006 Fogle, Crystelle, Montana DPHHS; McNamara, Michael, Montana DPHHS, [TODAY’S DATE].
- Page last reviewed: July 7, 2017
- Page last updated: July 7, 2017
- Content source: