

Map Details - US Prostate Cancer Incidence Rates by State
 ShareCompartir
Impact Statement
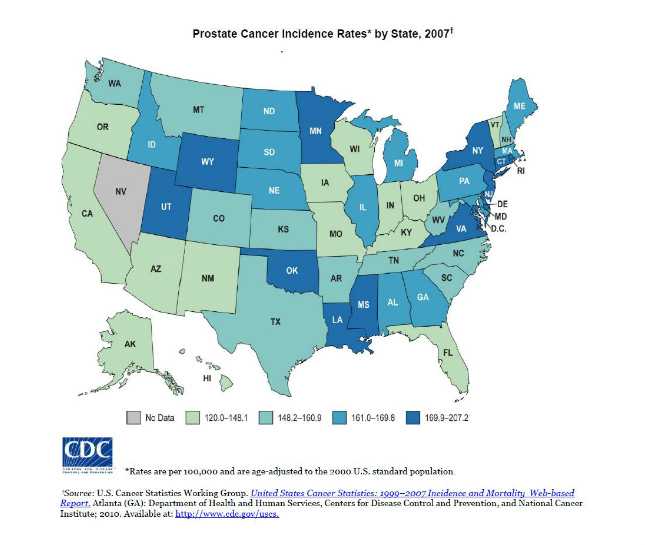
In this map, prostate cancer incidence rates by state are displayed for diagnosis year 2007. The U.S. states are divided into groups based on the rates at which men developed prostate cancer in 2007. The rates are the numbers out of 100,000 men who developed prostate cancer each year.
Software Used
Manually created.
Data Used
United States Cancer Statistics: 1999–2007 Incidence and Mortality Web-based Report; 2010.
Methods Used
Rates per 100,000 men, age-adjusted to 2000 U.S. standard population.
Contact the Submitter of this Map
Simple Singh, Epidemiologist, Centers for Disease Control and Prevention
(770) 488-4292
sdsingh@cdc.gov
How to Cite this Map
Prostate Cancer Incidence Rates by State, 2007 U.S. Cancer Statistics Working Group. United States Cancer Statistics: 1999–2007 Incidence and Mortality Web-based Report. Atlanta (GA): Department of Health and Human Services, Centers for Disease Control and Prevention, and National Cancer Institute; 2010. Available at: http://www.cdc.gov/uscs/, [TODAY’S DATE].
- Page last reviewed: July 7, 2017
- Page last updated: July 7, 2017
- Content source: