

Map Details - Minnesota Drive Times to Primary Stroke Centers
 ShareCompartir
Impact Statement
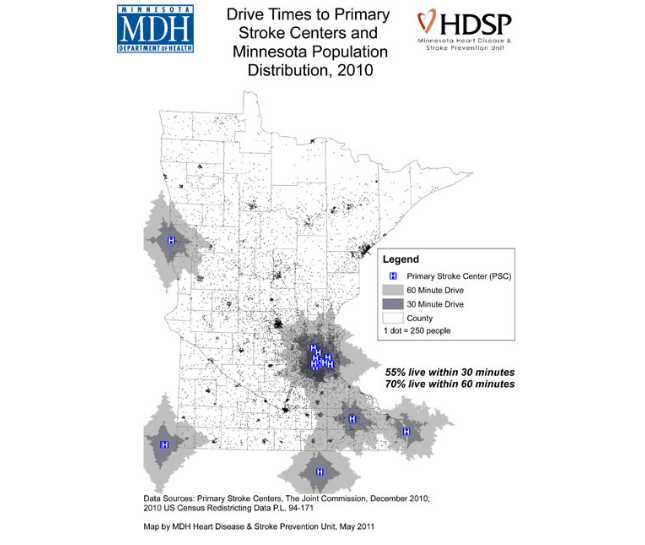
This maps shows the 2010 Census population distribution of Minnesota, along with the 30- and 60-minute drive time polygons around 19 Primary Stroke Centers (PSC) serving the state.
Findings
Using these data, 55% of Minnesotans live within 30 minutes and 70% live within 60 minutes of a PSC. As of December 2010, the 14 PSCs in Minnesota were in the Twin Cities Metropolitan Area or in Rochester; five additional PSCs were in border locations of neighboring states.
Population clusters in the major cities (Duluth, St. Cloud, and Mankato) and the many regional towns of outstate Minnesota are visible both within and outside the 60-minute drive time polygons to a PSC. Additional maps in this series show the distribution of population by race, ethnicity, and age.
This map illustrates the need for a statewide strategy to improve and increase capacity to treat stroke at all hospitals in the state of Minnesota. Additional maps highlighting access to hospitals with specific capacities, such as the presence of a stroke team in the ED, access to telemedicine consults, the presence of stroke unit care, and rehabilitation services, will further inform this planning process.
Software Used
ArcGIS 9.3.1
Data Used
2010 US Census Redistricting Data P.L. 94-171; Primary Stroke Centers as certified by the Joint Commission in December 2010.
Methods Used
30 minute and 60 minute drive time polygons were created around the 19 Primary Stroke Centers (14 in Minnesota, 2 in South Dakota, and 1 each in Iowa, North Dakota, and Wisconsin) that typically provide care for Minnesota residents who have a stroke. Under these drive time polygons is a dot density map showing the population distribution of Minnesota from the 2010 Census, with each dot representing 250 individuals. The population density is shown by census tract, but the tract borders have been removed in favor of county boundaries. The sum of the population in tracts located within the 30- and 60-minute drive time polygons is included under the legend.
Contact the Submitter of this Map
James Peacock, Epidemiologist Senior, Minnesota Department of Health
(651) 201-5405
james.peacock@state.mn.us
How to Cite this Map
Drive Times to Primary Stroke Centers and Minnesota Population Distribution, 2010 James Peacock, [TODAY’S DATE].
- Page last reviewed: July 13, 2017
- Page last updated: December 31, 2014
- Content source: