

Map Details - Cardiovascular Disease and Related Conditions, Adults in Hennepin County, Minnesota
 ShareCompartir
Impact Statement
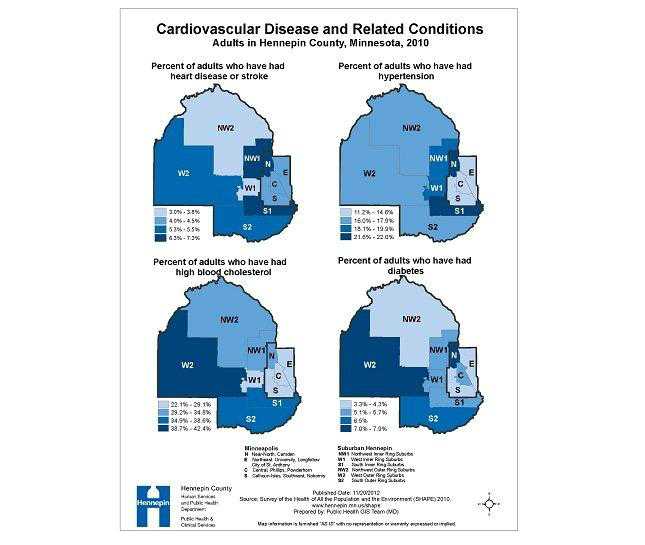
This map shows geographic distributions of different cardiovascular disease (CVD) and related conditions among adults in Hennepin County.
Purpose/Findings
Using hypertension as example, the rates in North Minneapolis and inner suburban rings are higher than the rates in other parts of city of Minneapolis, and outer suburban ring. However, for diabetes, rates are higher in the North Minneapolis and West and South suburban rings. There is no clear pattern among these four chronic disease and conditions in geographic distributions. This could be partially due to the fact that the rate is not age-standardized or could reflect differences in access to care.
The purpose of this map is to show the geographic variation of four cardiovascular disease and related conditions in a single map, and to allow examination of patterns or correlations. This map, along with the map on CVD death rates and the map on lifestyle and risk behaviors, informs local health department management, program staff, and relevant community groups and organizations of the burden of the CVD and stroke in the county, and to guide and monitor the focus of public health intervention.
Software Used
Arc GIS 10
Data Used
Hennepin County Human Services and Public Health Department, Survey of the Health of All the Population and the Environment (SHAPE), 2010. SHAPE reporting regions were created by HSPHD staff based on former Human Service Council areas and aggregated Minneapolis communities.
Methods Used
SHAPE 2010 Adult Survey is a self-administrated mail survey to randomly selected adults. Rates for the conditions displayed on this map were calculated from the responses provided by 7,000 adults age 18 and over who answered the survey questions about whether they had ever been told by a doctor that they have the specified condition. Respondent addresses were geocoded and aggregated within10 sub-county areas. Data were weighted to represent county population and data analyses were performed using STATA to account for complex survey design. The definition of each of the indicators can be found in the technical notes of SHAPE 2010 Adult Data Book, accessible at www.hennepin.us/shape. Geographic areas are defined according to Hennepin County and City of Minneapolis planning districts.
Contact the Submitter of this Map
Mei Ding, Principal Planning Analyst, Hennepin County Human Services and Public Health Department (HSPHD)
(612) 348-6309
mei.ding@co.hennepin.mn.us
How to Cite this Map
Cardiovascular disease and related conditions, adults in Hennepin County, Minnesota, 2010 Mei Ding, HSPHD; Jay Meehl, GIS Coordinator, HSPHD , [TODAY’S DATE].
- Page last reviewed: July 10, 2017
- Page last updated: July 10, 2017
- Content source: