Insurance coverage and barriers to care for people with asthma
Insurance coverage reduces, but does not eliminate, cost barriers for asthma care.
National estimates show that Americans with asthma are more likely to have health insurance than those without asthma. Among those with asthma, more children had health insurance coverage for the full year than adults. Coverage for children ranged from 89.3% in Arizona to 99.9% in Massachusetts and for adults from 77.8% in Texas to 96.7% in the District of Columbia.
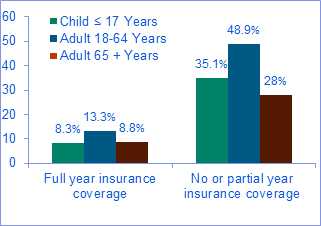
Both children and adults with asthma report cost barriers to health care, including not being able to afford asthma medication, to see a primary care doctor or asthma specialist. More adults aged 18-64 years report cost barriers, compared to children or adults aged 65 + years. For all age categories, the proportion of those reporting cost barriers is higher for those with no or partial year coverage, compared to those with full year coverage.
Percentage with cost barriers, by age and insurance coverage status, among persons with active asthma, Asthma Call-back Survey, 20 Areas, 2006-2010

Source: CDC’s Asthma Call-back Survey 2006-2010; 20 areas with 5 years of adult and child data. Estimates represent 5 year averages
* Child = Aged ≤17 years, Adult = Aged 18-64 years
% = Weighted Percent
Download this AsthmaStats Factsheet [PDF – 200 KB] containing additional information.
CDC’s National Asthma Control Program (NACP) was created in 1999 to help the millions of people with asthma in the United States gain control over their disease. The NACP conducts national asthma surveillance and funds states to help them improve their asthma surveillance and to focus efforts and resources where they are needed.
| Percentage with Insurance among People with Active Asthma by Area and Age | |||
|---|---|---|---|
| Area | Age* | Full Year Coverage | No/Partial Year Coverage |
| % | % | ||
| Arizona | Child | 89.3 | 10.7 |
| Adult | 88.7 | 11.3 | |
| California | Child | 98.0 | 2.0 |
| Adult | 83.5 | 16.5 | |
| Connecticut | Child | 98.6 | 1.4 |
| Adult | 90.4 | 9.6 | |
| District of Columbia | Child | 97.4 | 2.6 |
| Adult | 96.7 | 3.3 | |
| Georgia | Child | 97.0 | 3.0 |
| Adult | 81.8 | 18.2 | |
| Hawaii | Child | 97.0 | 3.0 |
| Adult | 93.3 | 6.7 | |
| Indiana | Child | 96.9 | 3.1 |
| Adult | 84.0 | 16.0 | |
| Iowa | Child | 98.8 | 1.2 |
| Adult | 89.7 | 10.3 | |
| Kansas | Child | 96.8 | 3.2 |
| Adult | 85.4 | 14.6 | |
| Maine | Child | 96.7 | 3.3 |
| Adult | 89.8 | 10.2 | |
| Maryland | Child | 95.9 | 4.1 |
| Adult | 90.8 | 9.2 | |
| Massachusetts | Child | 99.9 | 0.1 |
| Adult | 94.6 | 5.4 | |
| Michigan | Child | 99.4 | 0.6 |
| Adult | 85.1 | 14.9 | |
| Montana | Child | 95.8 | 4.2 |
| Adult | 79.1 | 20.9 | |
| Nebraska | Child | 96.4 | 3.6 |
| Adult | 83.9 | 16.1 | |
| New York | Child | 97.5 | 2.5 |
| Adult | 89.2 | 10.8 | |
| Oregon | Child | 93.8 | 6.2 |
| Adult | 82.7 | 17.3 | |
| Texas | Child | 90.7 | 9.3 |
| Adult | 77.8 | 22.2 | |
| Vermont | Child | 98.6 | 1.4 |
| Adult | 90.0 | 10.0 | |
| Wisconsin | Child | 98.9 | 1.1 |
| Adult | 90.6 | 9.4 | |
- Page last reviewed: May 3, 2013
- Page last updated: May 3, 2013
- Content source:


 ShareCompartir