

Cancer and Tobacco Use
Tobacco use causes many cancers
 ShareCompartir
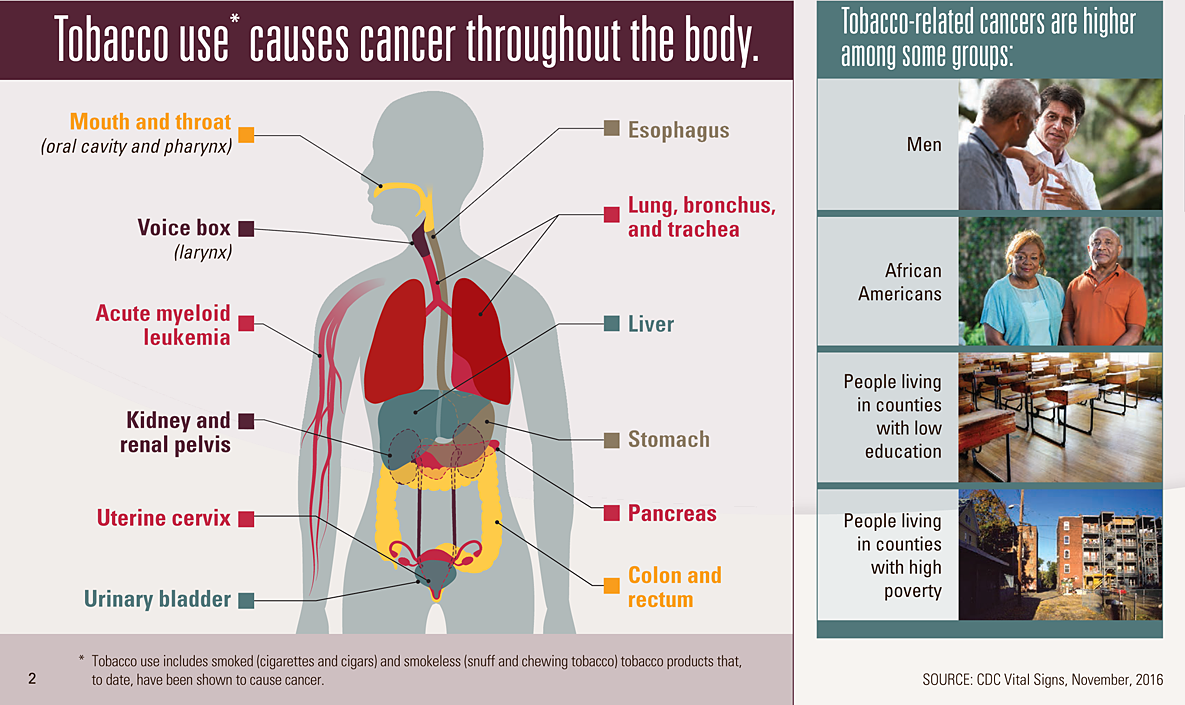
Tobacco use* causes cancer throughout the body.
Picture of body identifying 12 tobacco-related cancers.
- Mouth and throat (oral cavity and pharynx)
- Voice box (larynx)
- Esophagus
- Lung, bronchus, and trachea
- Stomach
- Kidney and renal pelvis
- Pancreas
- Liver
- Urinary bladder
- Uterine cervix
- Colon and rectum
- Acute myeloid leukemia
* Tobacco use includes smoked (cigarettes and cigars) and smokeless (snuff and chewing tobacco) tobacco products that, to date, have been shown to cause cancer.
Tobacco-related cancers are higher among some groups:
Table of groups that are more likely to get tobacco-related cancers
| Group | Photo Description |
| Men | Photo shows two men talking. |
| African Americans | Photo shows an African American woman and man standing next to each other. |
| People living in counties with low education | Photo shows traditional rural classroom with wooden desks and wooden floor. |
| People living in counties with high poverty | Photo shows low-income apartment complex. |
SOURCE: CDC Vital Signs, November, 2016
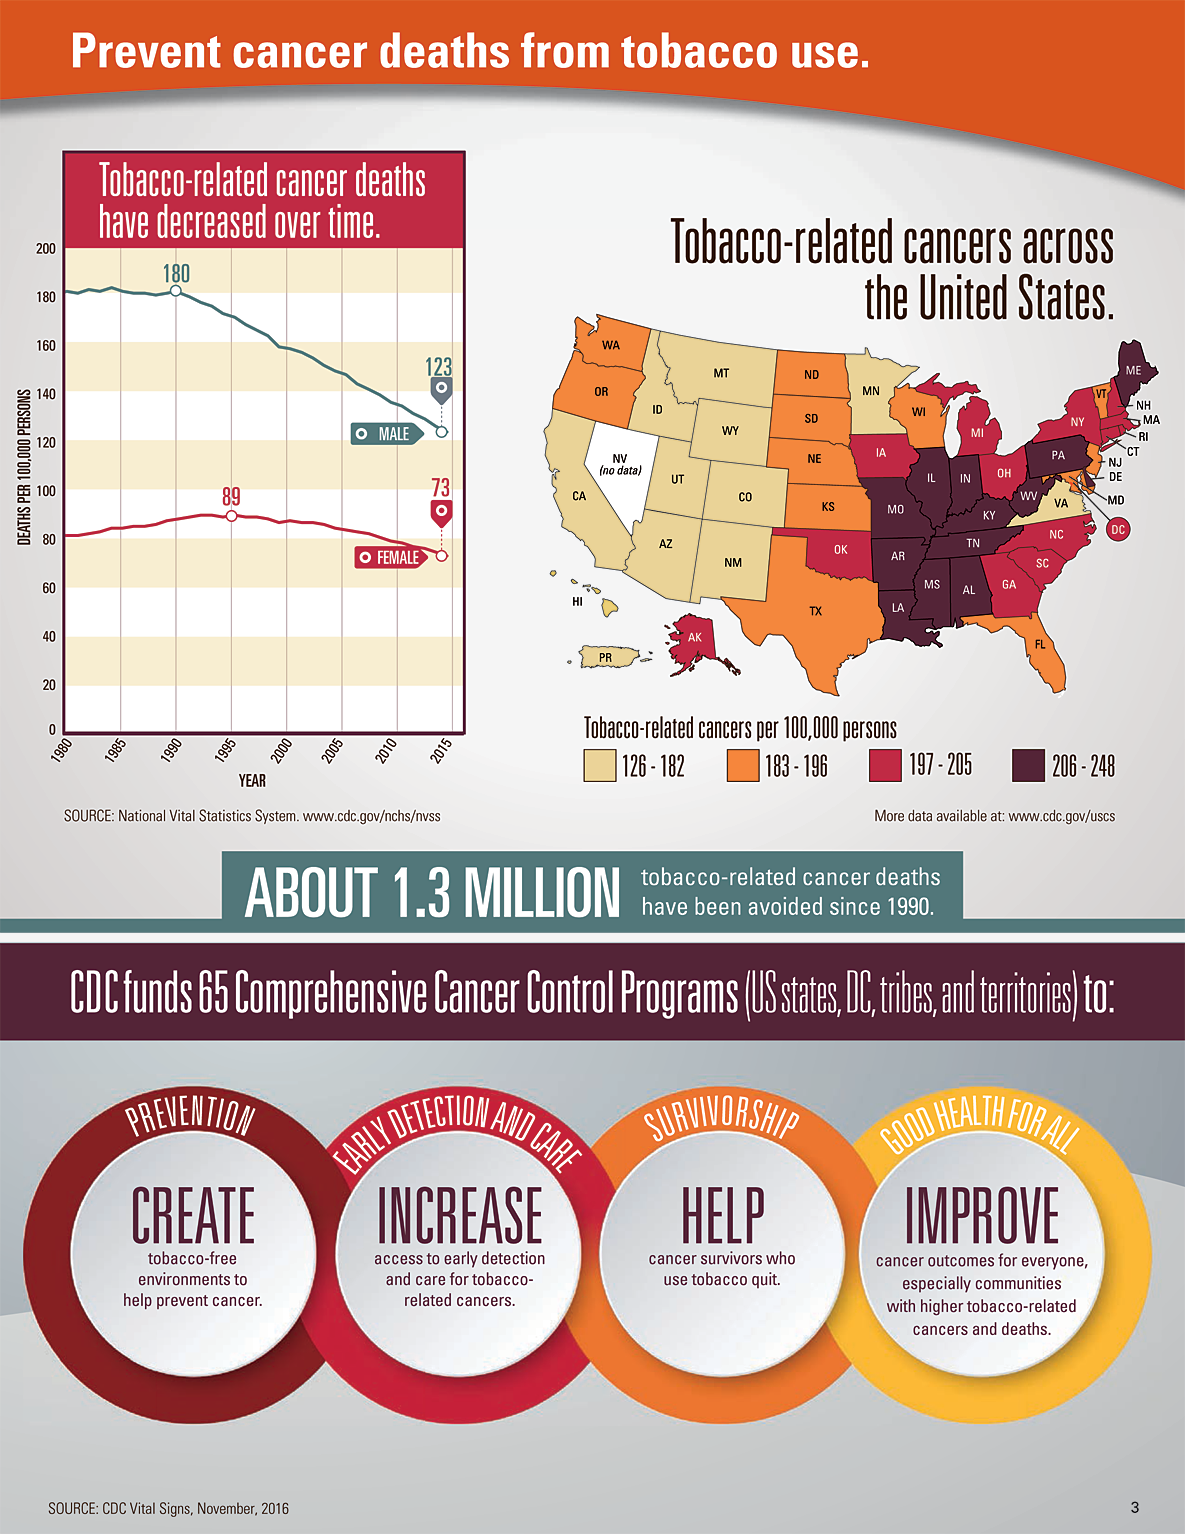
Tobacco-related cancer deaths have decreased over time
| Year | Male | Female |
| 1980 | 180.4 | 80.6 |
| 1981 | 179.9 | 80.7 |
| 1982 | 181.2 | 81.4 |
| 1983 | 180.4 | 82.7 |
| 1984 | 181.6 | 83.8 |
| 1985 | 180.6 | 84.2 |
| 1986 | 179.6 | 84.5 |
| 1987 | 179.8 | 84.9 |
| 1988 | 178.7 | 85.5 |
| 1989 | 179.3 | 87.2 |
| 1990 | 180.2 | 88.0 |
| 1991 | 178.3 | 88.4 |
| 1992 | 175.7 | 88.8 |
| 1993 | 174.4 | 89.0 |
| 1994 | 171.8 | 88.8 |
| 1995 | 169.5 | 89.2 |
| 1996 | 166.6 | 88.5 |
| 1997 | 164.3 | 88.0 |
| 1998 | 162.1 | 88.0 |
| 1999 | 158.1 | 86.4 |
| 2000 | 157.3 | 87.2 |
| 2001 | 155.7 | 86.5 |
| 2002 | 153.6 | 86.3 |
| 2003 | 150.6 | 85.3 |
| 2004 | 147.6 | 84.0 |
| 2005 | 146.2 | 83.2 |
| 2006 | 142.9 | 82.6 |
| 2007 | 140.3 | 81.7 |
| 2008 | 138.1 | 80.4 |
| 2009 | 135.1 | 78.6 |
| 2010 | 133.7 | 77.9 |
| 2011 | 130.5 | 76.6 |
| 2012 | 128.3 | 75.4 |
| 2013 | 125.4 | 74.0 |
| 2014 | 122.8 | 72.9 |
Tobacco-related cancers across the United States
US map of annual rate of tobacco-related cancers per 100,000 persons (2009–2013)
| Category | Rank | State |
Rate |
| Category 1 | 1 | Puerto Rico |
126 |
| 126 – 182 | 2 | Utah |
131 |
| 3 | New Mexico |
154 |
|
| YELLOW | 4 | Colorado |
159 |
| 5 | Wyoming |
166 |
|
| 6 | Arizona |
168 |
|
| 7 | California |
169 |
|
| 8 | Idaho |
175 |
|
| 9 | Hawaii |
177 |
|
| 10 | Minnesota |
181 |
|
| 11 | Virginia |
181 |
|
| 12 | Montana |
182 |
|
| Category 2 | 13 | Texas |
184 |
| 183 – 196 | 14 | Oregon |
184 |
| 15 | Maryland |
184 |
|
| ORANGE | 16 | Nebraska |
187 |
| 17 | South Dakota |
187 |
|
| 18 | Washington |
188 |
|
| 19 | North Dakota |
189 |
|
| 20 | Florida |
189 |
|
| 21 | Vermont |
192 |
|
| 22 | Kansas |
192 |
|
| 23 | Wisconsin |
193 |
|
| 24 | New Jersey |
196 |
|
| Category 3 | 25 | Georgia |
197 |
| 197 – 205 | 26 | Alaska |
197 |
| 27 | District of Columbia |
198 |
|
| RED | 28 | Massachusetts |
199 |
| 29 | South Carolina |
199 |
|
| 30 | North Carolina |
199 |
|
| 31 | New York |
200 |
|
| 32 | Michigan |
200 |
|
| 33 | New Hampshire |
201 |
|
| 34 | Connecticut |
202 |
|
| 35 | Iowa |
202 |
|
| 36 | Ohio |
203 |
|
| 37 | Oklahoma |
205 |
|
| 38 | Rhode Island |
205 |
|
| Category 4 | 39 | Alabama |
207 |
| 206 – 248 | 40 | Illinois |
208 |
| 41 | Pennsylvania |
208 |
|
| BROWN | 42 | Delaware |
209 |
| 43 | Missouri |
209 |
|
| 44 | Indiana |
210 |
|
| 45 | Tennessee |
210 |
|
| 46 | Arkansas |
210 |
|
| 47 | Maine |
211 |
|
| 48 | Louisiana |
221 |
|
| 49 | Mississippi |
222 |
|
| 50 | West Virginia |
225 |
|
| 51 | Kentucky |
248 |
|
| Category 5 – no data | 52 | Nevada |
More data available at: www.cdc.gov/uscs
ABOUT 1.3 MILLION tobacco-related cancer deaths have been avoided since 1990.
CDC funds 65 Comprehensive Cancer Control Programs (US states, DC, tribes, and territories) to:
Graphic of cancer control continuum highlighting prevention, early detection and care, survivorship, and good health for all.
PREVENTION
CREATE
Tobacco-free environments to help prevent cancer.
EARLY DETECTION AND CARE
INCREASE
Access to early detection and care for tobacco-related cancers.
SURVIVORSHIP
HELP
Cancer survivors who use tobacco quit.
GOOD HEALTH FOR ALL
IMPROVE
Cancer outcomes for everyone, especially communities with higher tobacco-related cancers and deaths.
SOURCE: CDC Vital Signs, November, 2016
- Page last reviewed: July 28, 2017
- Page last updated: July 28, 2017
- Content source:
- National Center for Chronic Disease Prevention and Health Promotion
- Page maintained by: Office of the Associate Director for Communications (OADC)