

Native Americans with Diabetes
Better diabetes care can decrease kidney failure
 ShareCompartir
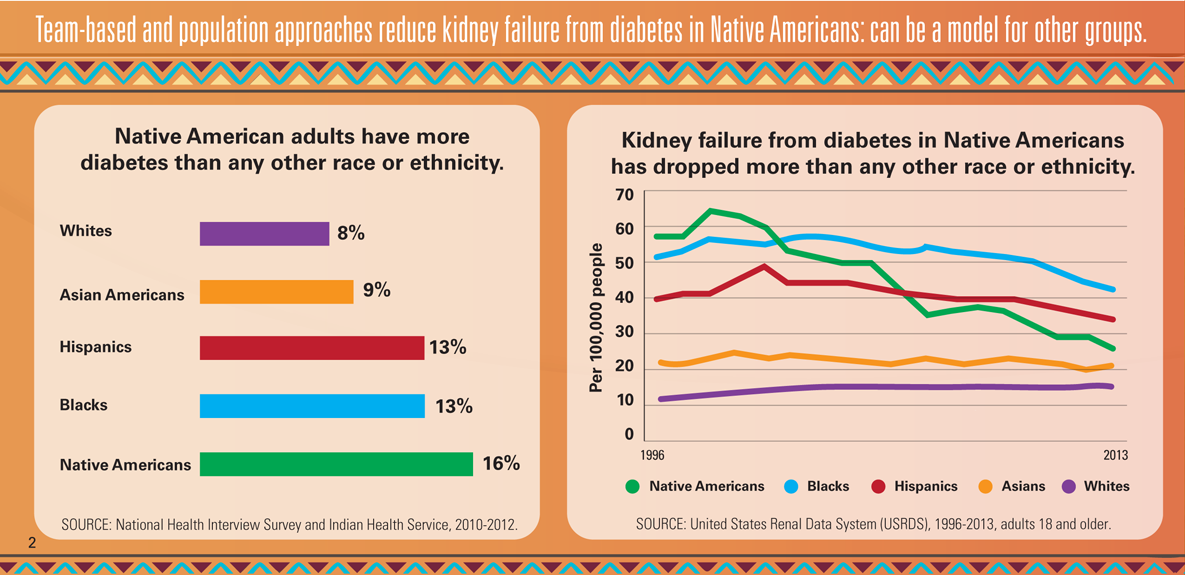
Team-based and population approaches reduce kidney failure from diabetes in Native Americans: can be a model for other groups
Native American adults have more diabetes than any other race or ethnicity.
Whites 8%
Asian Americans 9%
Hispanics 13%
Blacks 13%
Native Americans 16%
SOURCE: National Health Interview Survey and Indian Health Service, 2010-2012.
Kidney failure from diabetes in Native Americans has dropped more than any other race or ethnicity.
Trend graphic comparing kidney failure from diabetes in Native Americans to other groups from 1996 to 2013. In 1996, Native Americans had more kidney failure than blacks, Hispanics, Asians and whites. However, by 2013, Native Americans were third in kidney failure from diabetes despite having the most diabetes.
| General population | 1996 | 2013 | % change |
|---|---|---|---|
| American Indians/Alaska Natives | 57.3 | 26.5 | -54 |
| Asians | 23.1 | 22.2 | -4 |
| Blacks | 52.2 | 42.7 | -18 |
| Whites | 12.1 | 15.5 | +28 |
| Hispanics | 40.1 | 34.2 | -15 |
Per 100,000 people
SOURCE: United States Renal Data System (USRDS), 1996-2013, adults 18 and older.
Improving team-based diabetes care supports kidney disease reductions
Graphic showing the percent of Special Diabetes Program for Indians (SDPI) Sites reporting diabetes services in 1997 and 2013. Bars show the percent for each intervention.
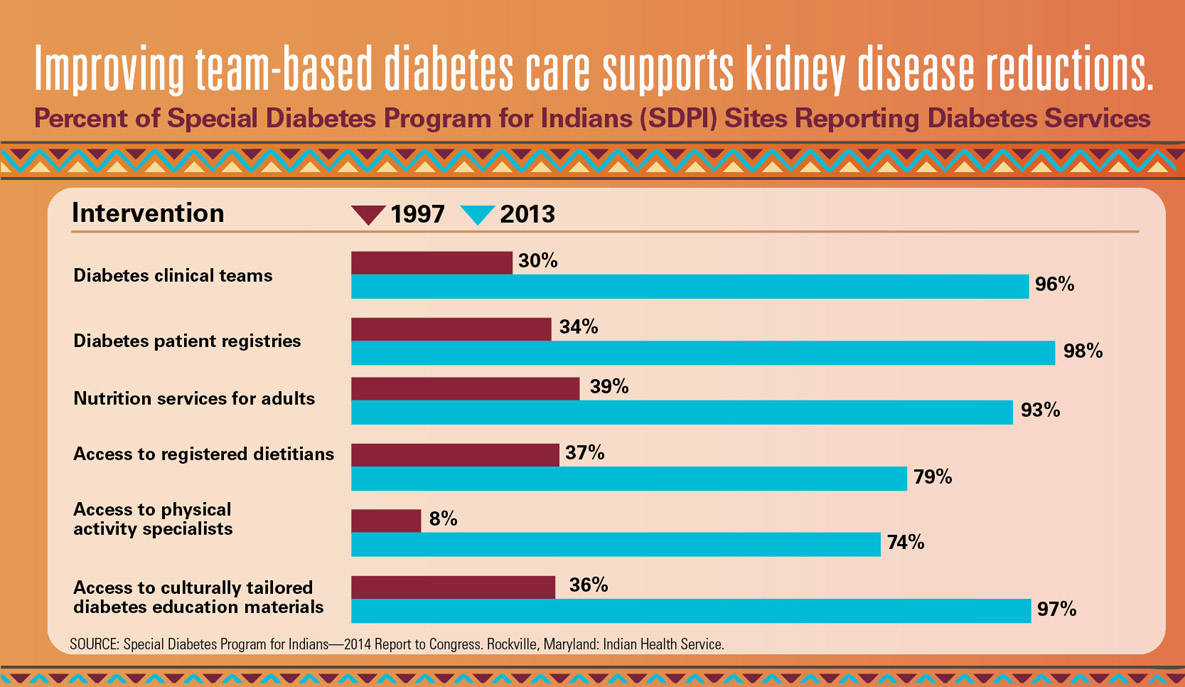
Percent of Special Diabetes Program for Indians (SDPI) Reporting Diabetes Services Intervention
|
Intervention |
Percent |
|---|---|
| Diabetes clinical teams--1997 |
30% |
| Diabetes clinical teams—2013 |
96% |
| Diabetes patient registries—1997 |
34% |
| Diabetes patient registries—2013 |
98% |
| Nutrition services for adults—1997 |
39% |
| Nutrition services for adults—2013 |
93% |
| Access to registered dietitians--1997 |
37% |
| Access to registered dieticians—2013 |
79% |
| Access to physical activity specialists |
8% |
| Access to physical activity specialists—2013 |
74% |
| Access to culturally tailored diabetes education materials—1997 |
36% |
| Access to culturally tailored diabetes education materials |
97% |
A Model for Diabetes Care
A one-page infographic that depicts the “story” of one particular fictitious patient (Joe). It also includes text boxes with information about what Health Care Systems can do to reach out to entire communities Team-Based Patient Care and Population Management strategies.
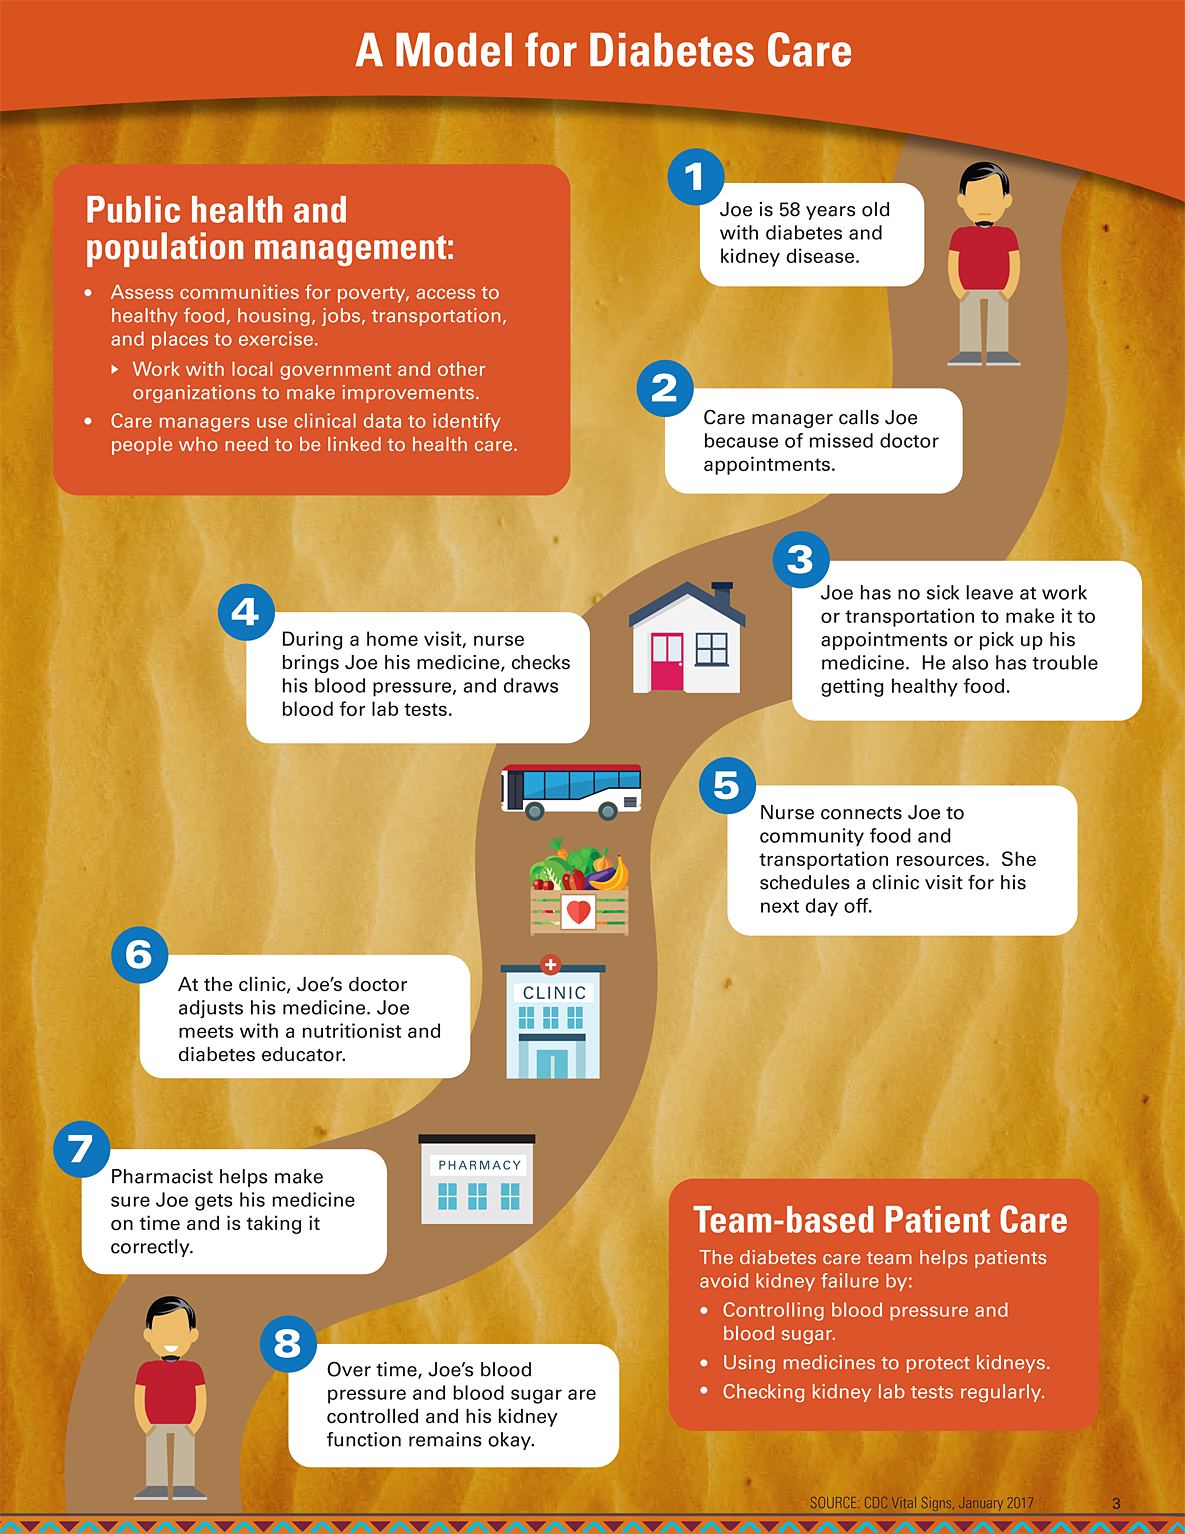
Public health and population management:
- Assess communities for poverty, access to healthy food, housing, jobs, transportation, and places to exercise.
- Work with local government and other organizations to make improvements.
- Care managers use clinical data to identify people who need to be linked to health care.
- Joe is 58 years old with diabetes and kidney disease.
- Care manager calls Joe because of missed doctor appointments.
- Joe has no sick leave at work or transportation to make it to appointments or pick up his medicine. He also has trouble getting healthy food.
- During a home visit, nurse brings Joe his medicine, checks his blood pressure, and draws blood for lab tests.
- Nurse connects Joe to community food and transportation resources. She schedules a clinic visit for his next day off.
- At the clinic, Joe’s doctor adjusts his medicine. Joe meets with a nutritionist and diabetes educator.
- Pharmacist helps make sure Joe gets his medicine on time and is taking it correctly.
- Over time, Joe’s blood pressure and blood sugar are controlled and his kidney function remains okay.
Team-based Patient Care
The diabetes care team helps patients avoid kidney failure by:
- Controlling blood pressure and blood sugar.
- Using medicines to protect kidneys.
- Checking kidney lab tests regularly.
SOURCE: CDC Vital Signs, January 2017
- Page last reviewed: January 10, 2017
- Page last updated: January 10, 2017
- Content source:
Error processing SSI file