

Figure Y. Proportion of MSM* Attending STD Clinics with Primary and Secondary Syphilis, Gonorrhea (GC) or Chlamydia (CT) by HIV Status†, STD Surveillance Network (SSuN), 2015
 ShareCompartir
This web page is archived for historical purposes and is no longer being updated. Newer data is available on the STD Data and Statistics page.
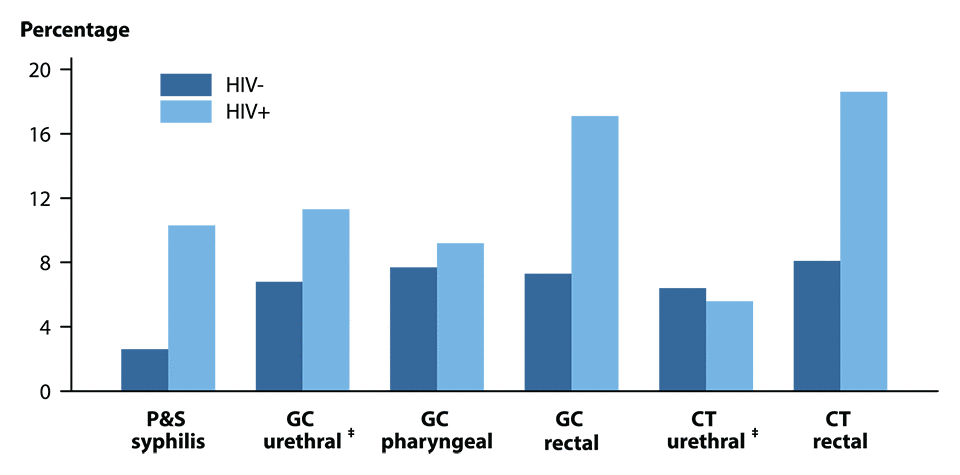
* MSM = Gay, bisexual, and other men who have sex with men (collectively referred to as MSM).
† Excludes all persons for whom there was no laboratory documentation or self-report of HIV status.
‡ GC urethral and CT urethral include results from both urethral and urine specimens.
NOTE: See section A2.2 in Appendix A for SSuN methods.
- Page last reviewed: October 6, 2016 (archived document)
- Content source: