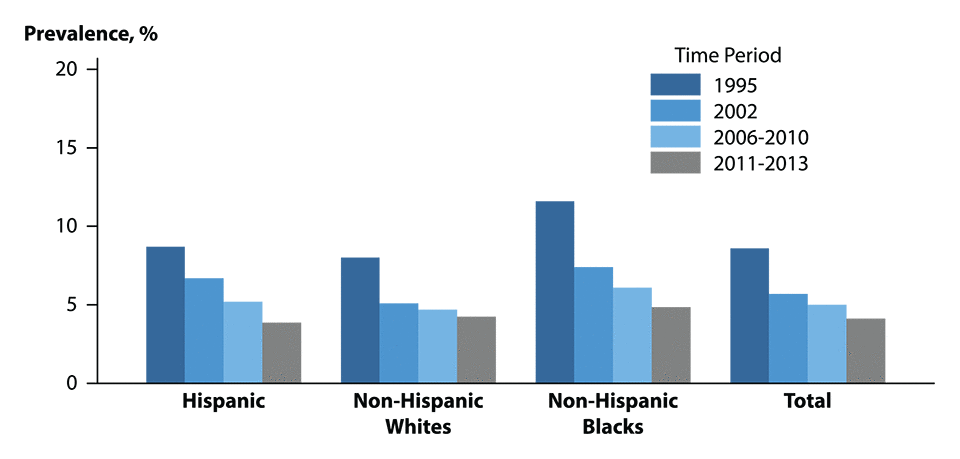
Figure F. Pelvic Inflammatory Disease — Lifetime Prevalence of Treatment Among Sexually Experienced Women Aged 15–44 Years by Race/Ethnicity and Time Period, National Survey of Family Growth, 1995, 2002, 2006–2010, 2011–2013
This web page is archived for historical purposes and is no longer being updated. Newer data is available on the STD Data and Statistics page.

SOURCE: Leichliter, J, Chandra A, Aral SO. Correlates of Self-Reported Pelvic Inflammatory Disease Treatment in Sexually Experienced Reproductive-Aged Women in the United States, 1995, 2002, and 2006–2010. Sex Transm Dis. 2013;40(5):413–418; Additional data for 2011–2013 provided separately.
- Page last reviewed: October 6, 2016 (archived document)
- Content source:


 ShareCompartir