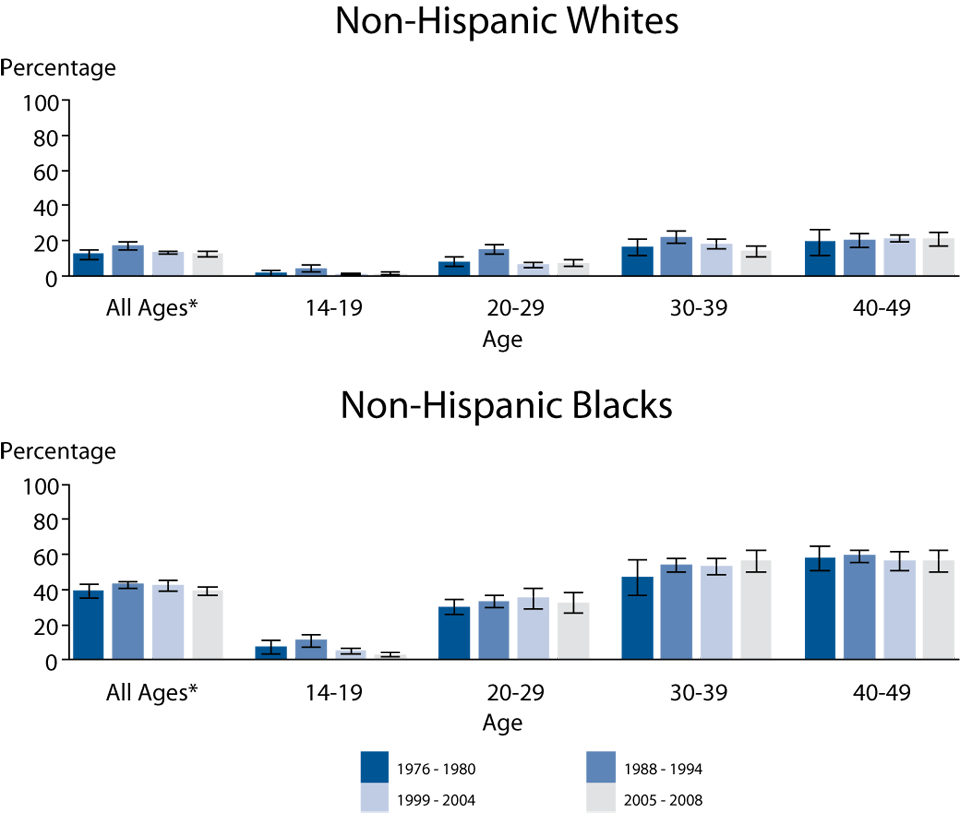
Figure 49. Herpes Simplex Virus Type 2 — Seroprevalence Among Non-Hispanic Whites and Non-Hispanic Blacks by Age Group, National Health and Nutrition Examination Survey, 1976 – 1980, 1988 – 1994, 1999 – 2004, 2005 – 2008
This web page is archived for historical purposes and is no longer being updated. Newer data is available on the STD Data and Statistics page.

* Age-adjusted by using the 2000 U.S. Census civilian, non-institutionalized population aged 14–49 years as the standard.
NOTE: Error bars indicate 95% confidence interval.
- Page last reviewed: January 7, 2014 (archived document)
- Content source:


 ShareCompartir