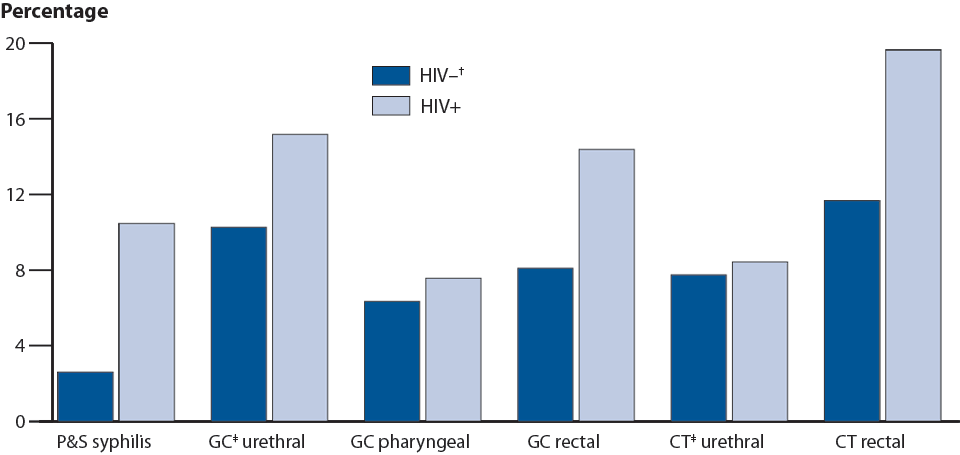
Figure Y. STD Surveillance Network (SSuN)—Proportion of MSM* Attending STD Clinics with Primary and Secondary Syphilis, Gonorrhea or Chlamydia by HIV* Status, 2010
This web page is archived for historical purposes and is no longer being updated. Newer data is available on the STD Data and Statistics page.

* MSM = men who have sex with men; HIV = human immunodeficiency virus, P&S = primary and secondary; GC = gonorrhea; CT = chlamydia.
† HIV negative status includes persons of unknown status for this analysis.
‡ GC urethral and CT urethral include results from both urethral and urine specimens.
- Page last reviewed: November 17, 2011 (archived document)
- Content source:


 ShareCompartir