Skip directly to search Skip directly to A to Z list Skip directly to page options Skip directly to site content

STD Trends in the United States: 2010 National Data for Gonorrhea, Chlamydia, and Syphilis

 
This web page is archived for historical purposes and is no longer being updated. Newer data is available on the STD Data and Statistics page.
 

Snapshot: Sexually Transmitted Diseases in 2010
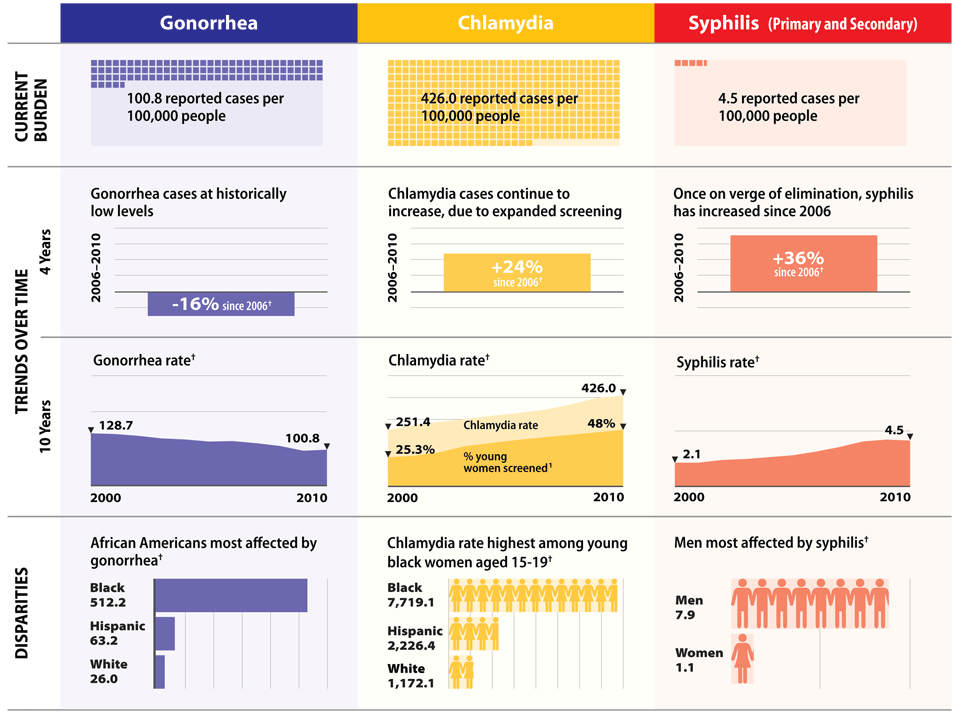

 Complex table of graphics showing a snapshot of STD Trends in the United States. Columns from left to right are 1) Gonorrhea 2)Chlamydia and 3) Syphilis. Row 1) Current Burden Gonorrhea 100.8 reported cases per 100,000 people Chlamydia 426.0 reported cases per 100,000 people Syphilis 4.5 reported cases per 100,000 people Row 2) Trends Over Time Sub-row 1) 4 Years, 2006-2010 Gonorrhea cases at historically low levels / -16% since 2006 / dagger symbol Chlamydia cases continue to increase, due to expanded screening / +24% since 2006 / dagger symbol Once on verge of elimination, syphilis has increased since 2006 / +365 since 2006 / dagger symbol Row 2) Trends Over Time Sub-row 2) 10 Years, 2000-2010 Gonorrhea Rate / dagger symbol 2000: 128.7 2010: 100.8 Chlamydia Rate / dagger symbol 2000: 251.4 2010: 426.0 % of young women screened / see footnote 1 2000: 25.3% 2010: 48% Syphilis Rate / dagger symbol 2000: 2.1 2010: 4.5 Row 3) Disparities African Americans most affected by gonorrhea / dagger symbol Black: 512.2 Hispanic: 63.2 White: 26.0 Chlamydia rate highest among young black women aged 15-19 / dagger symbol Black: 7,719.1 Hispanic: 2,226.4 White: 1,172.1 Men most affected by syphilis / dagger symbol Men: 7.9 Women: 1.1

† All rates are for reported cases per 100,000 people

1 Screening data are from the Healthcare Effectiveness Data and Information Set (HEDIS), which assesses the proportion of sexually active females between the ages of 15 and 25 screened for chlamydia. Available at www.ncqa.org

Source: CDC, Sexually Transmitted Diseases Surveillance, 2010.

Next: Table

Top