

Data and Statistics
 ShareCompartir
Short Sleep Duration Among US Adults
Adults need 7 or more hours of sleep per night for the best health and wellbeing.1 Short sleep duration is defined as less than 7 hours of sleep per 24-hour period.
Geographic Variation in Short Sleep Duration
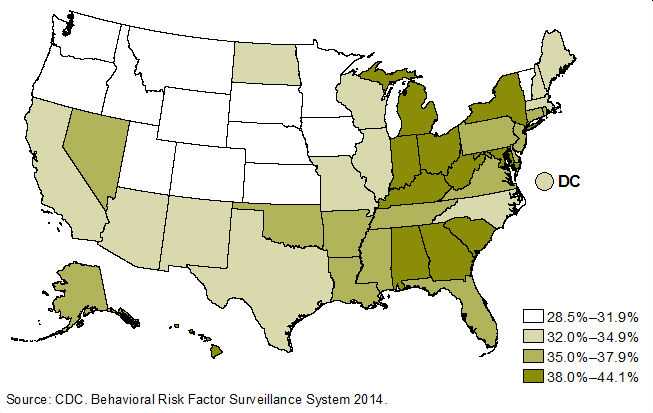
Figure 1 shows the age-adjusted percentage of adults who reported short sleep duration (less than 7 hours of sleep per 24-hour period), by state in the United States in 2014. The percentage varies considerably by state, from <30% in Colorado, South Dakota, and Minnesota to ≥40% in Kentucky and Hawaii. The highest percentages were in the southeastern United States and in states along the Appalachian Mountains. The lowest percentages were in the Great Plains states.
Figure 1. Age-Adjusted Prevalence of Short Sleep Duration (<7 hours) Among Adults Aged ≥18 Years, by State, United States, 2014
The Behavioral Risk Factor Surveillance System (BRFSS) provides data critical for monitoring national and state population health. However, the BRFSS surveys do not have sufficient samples to produce direct survey estimates for most counties or sub-county areas. Therefore, we used BRFSS data to estimate short sleep duration prevalence at different geographic levels, including counties, congressional districts, and census tracts (see Figures 2, 3 and 4) using a previously developed model.2 These estimates could be used in a variety of contexts and meet the diverse small-area health data needs of local policy makers, program planners, and communities for public health program planning and evaluation.
Figure 2. Prevalence of Short Sleep Duration (<7 hours) for Adults Aged ≥ 18 Years, by County, United States, 2014
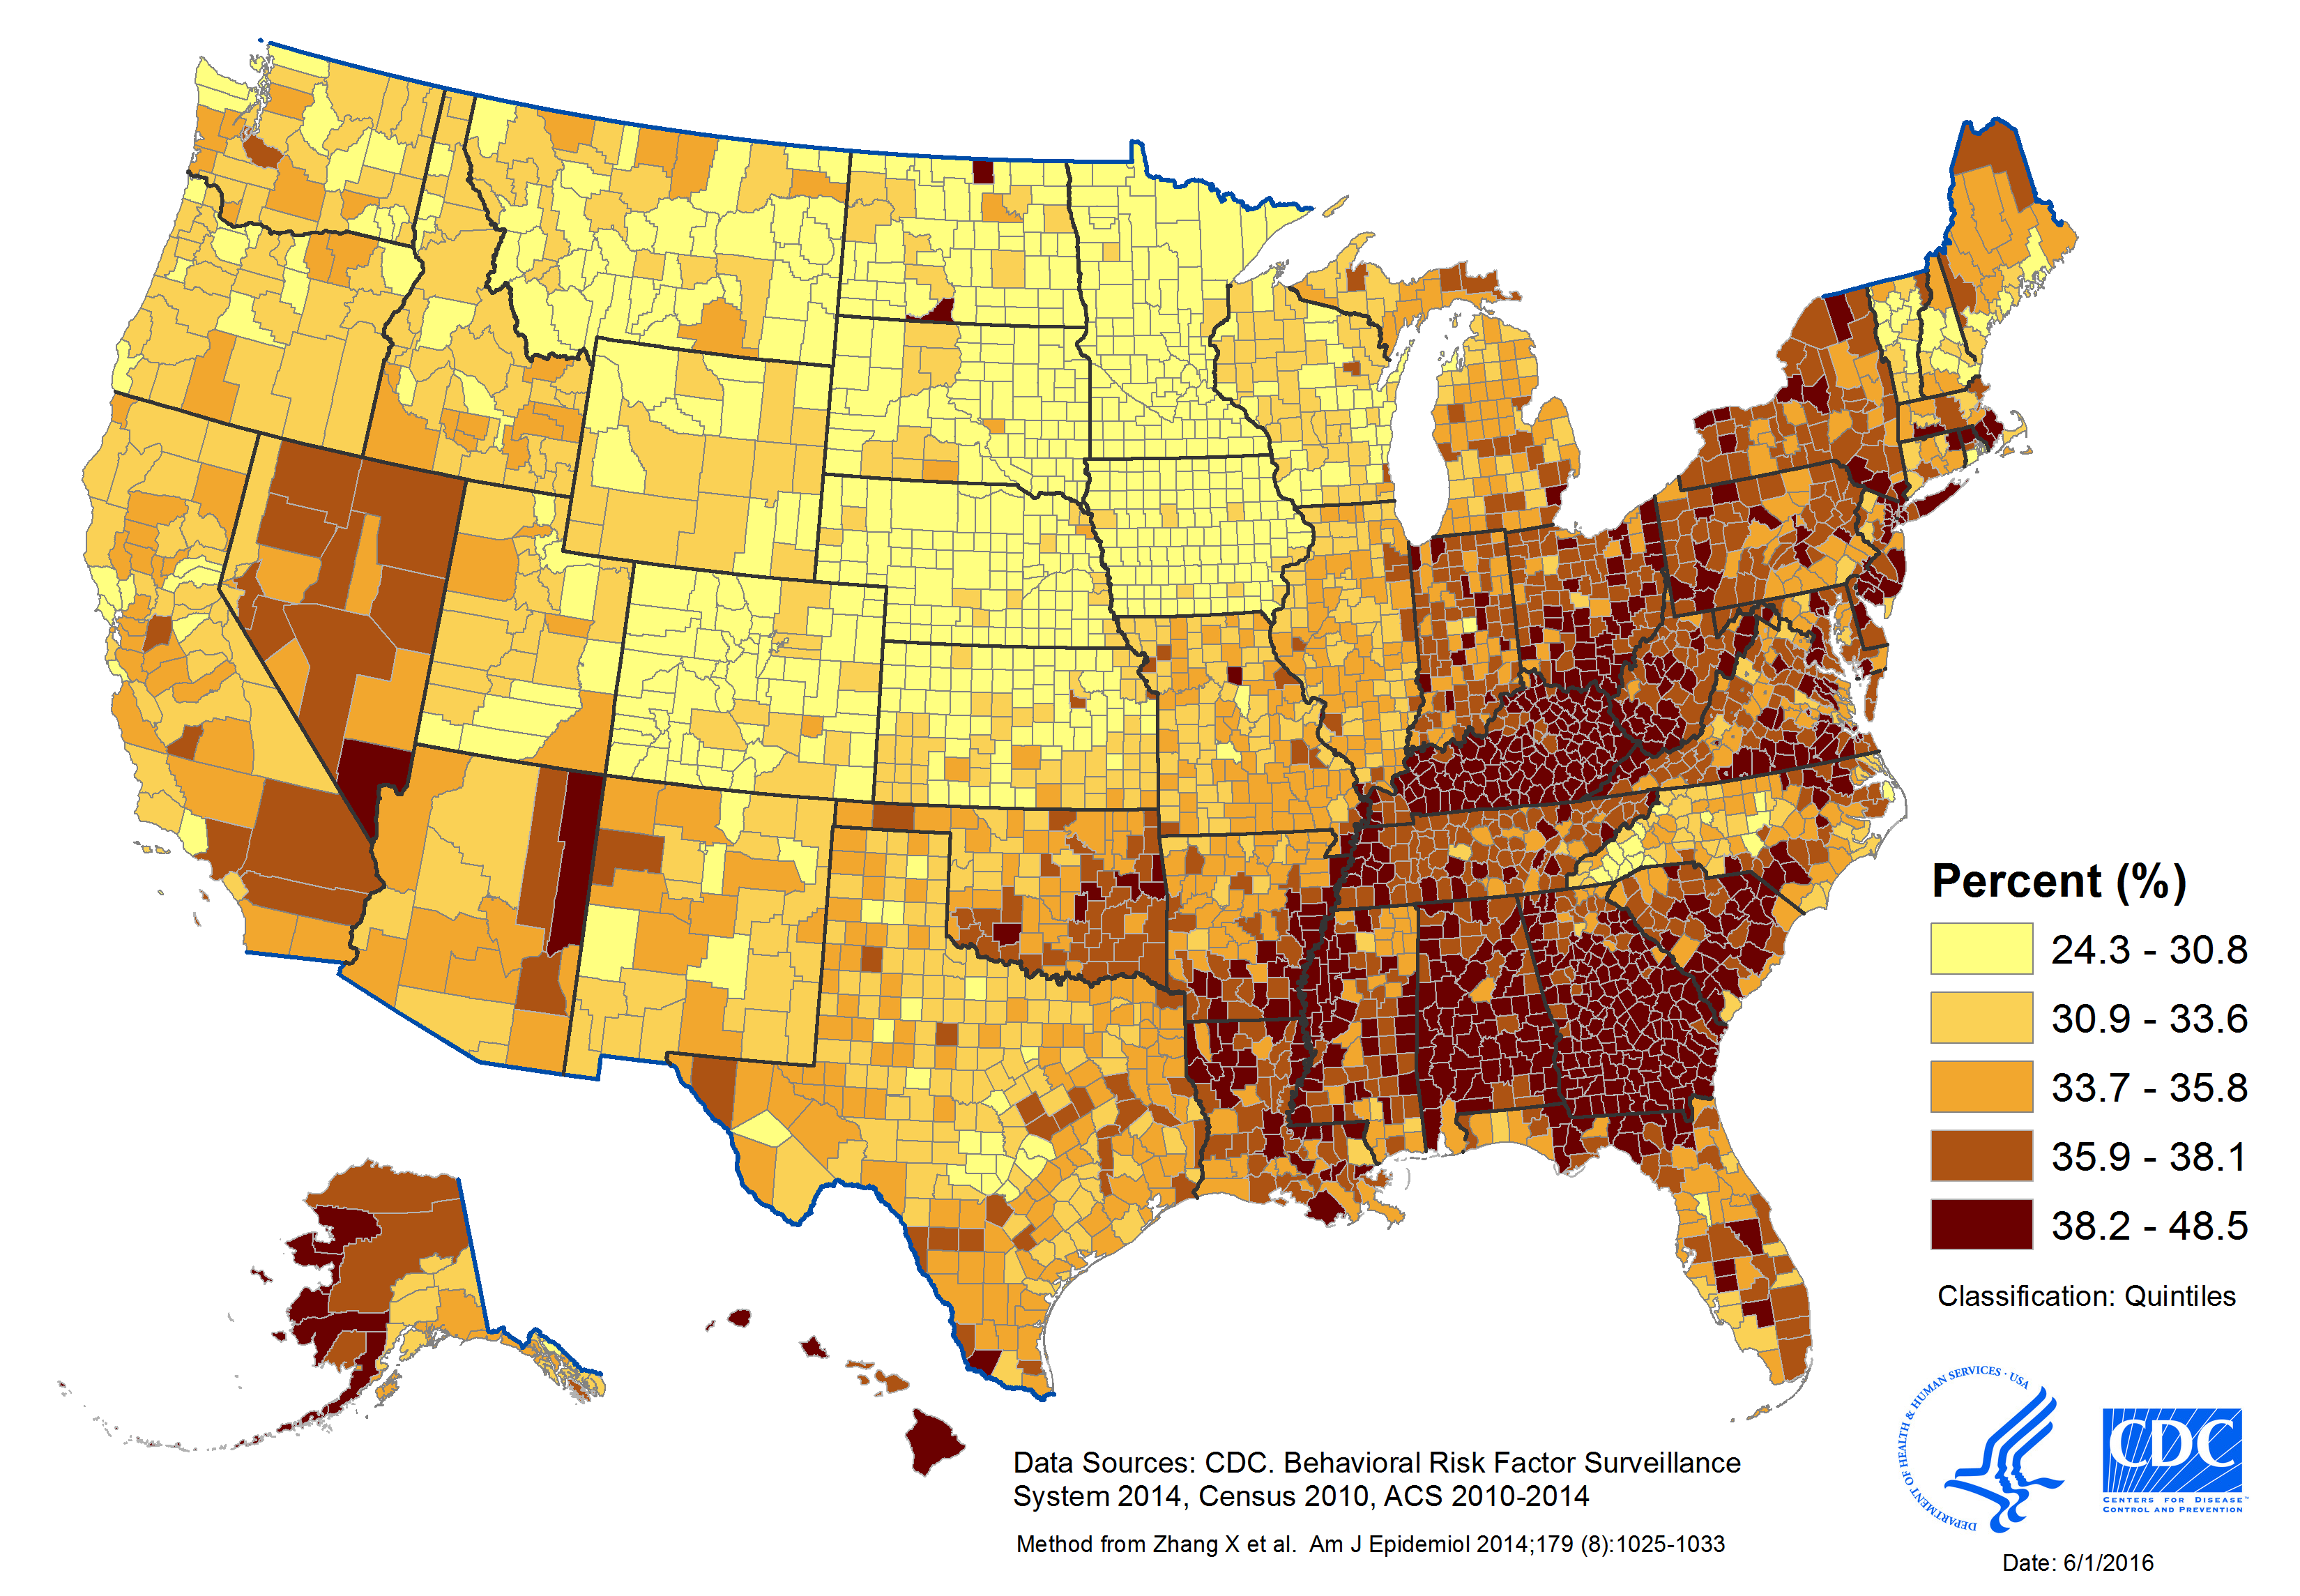
Learn how the counties in your state rank in prevalence of short sleep duration (insufficient sleep) at the County Health Rankings & Roadmaps website.
Figure 3. Prevalence of Short Sleep Duration (<7 hours) for Adults Aged ≥ 18 Years, by Congressional District, United States, 2014
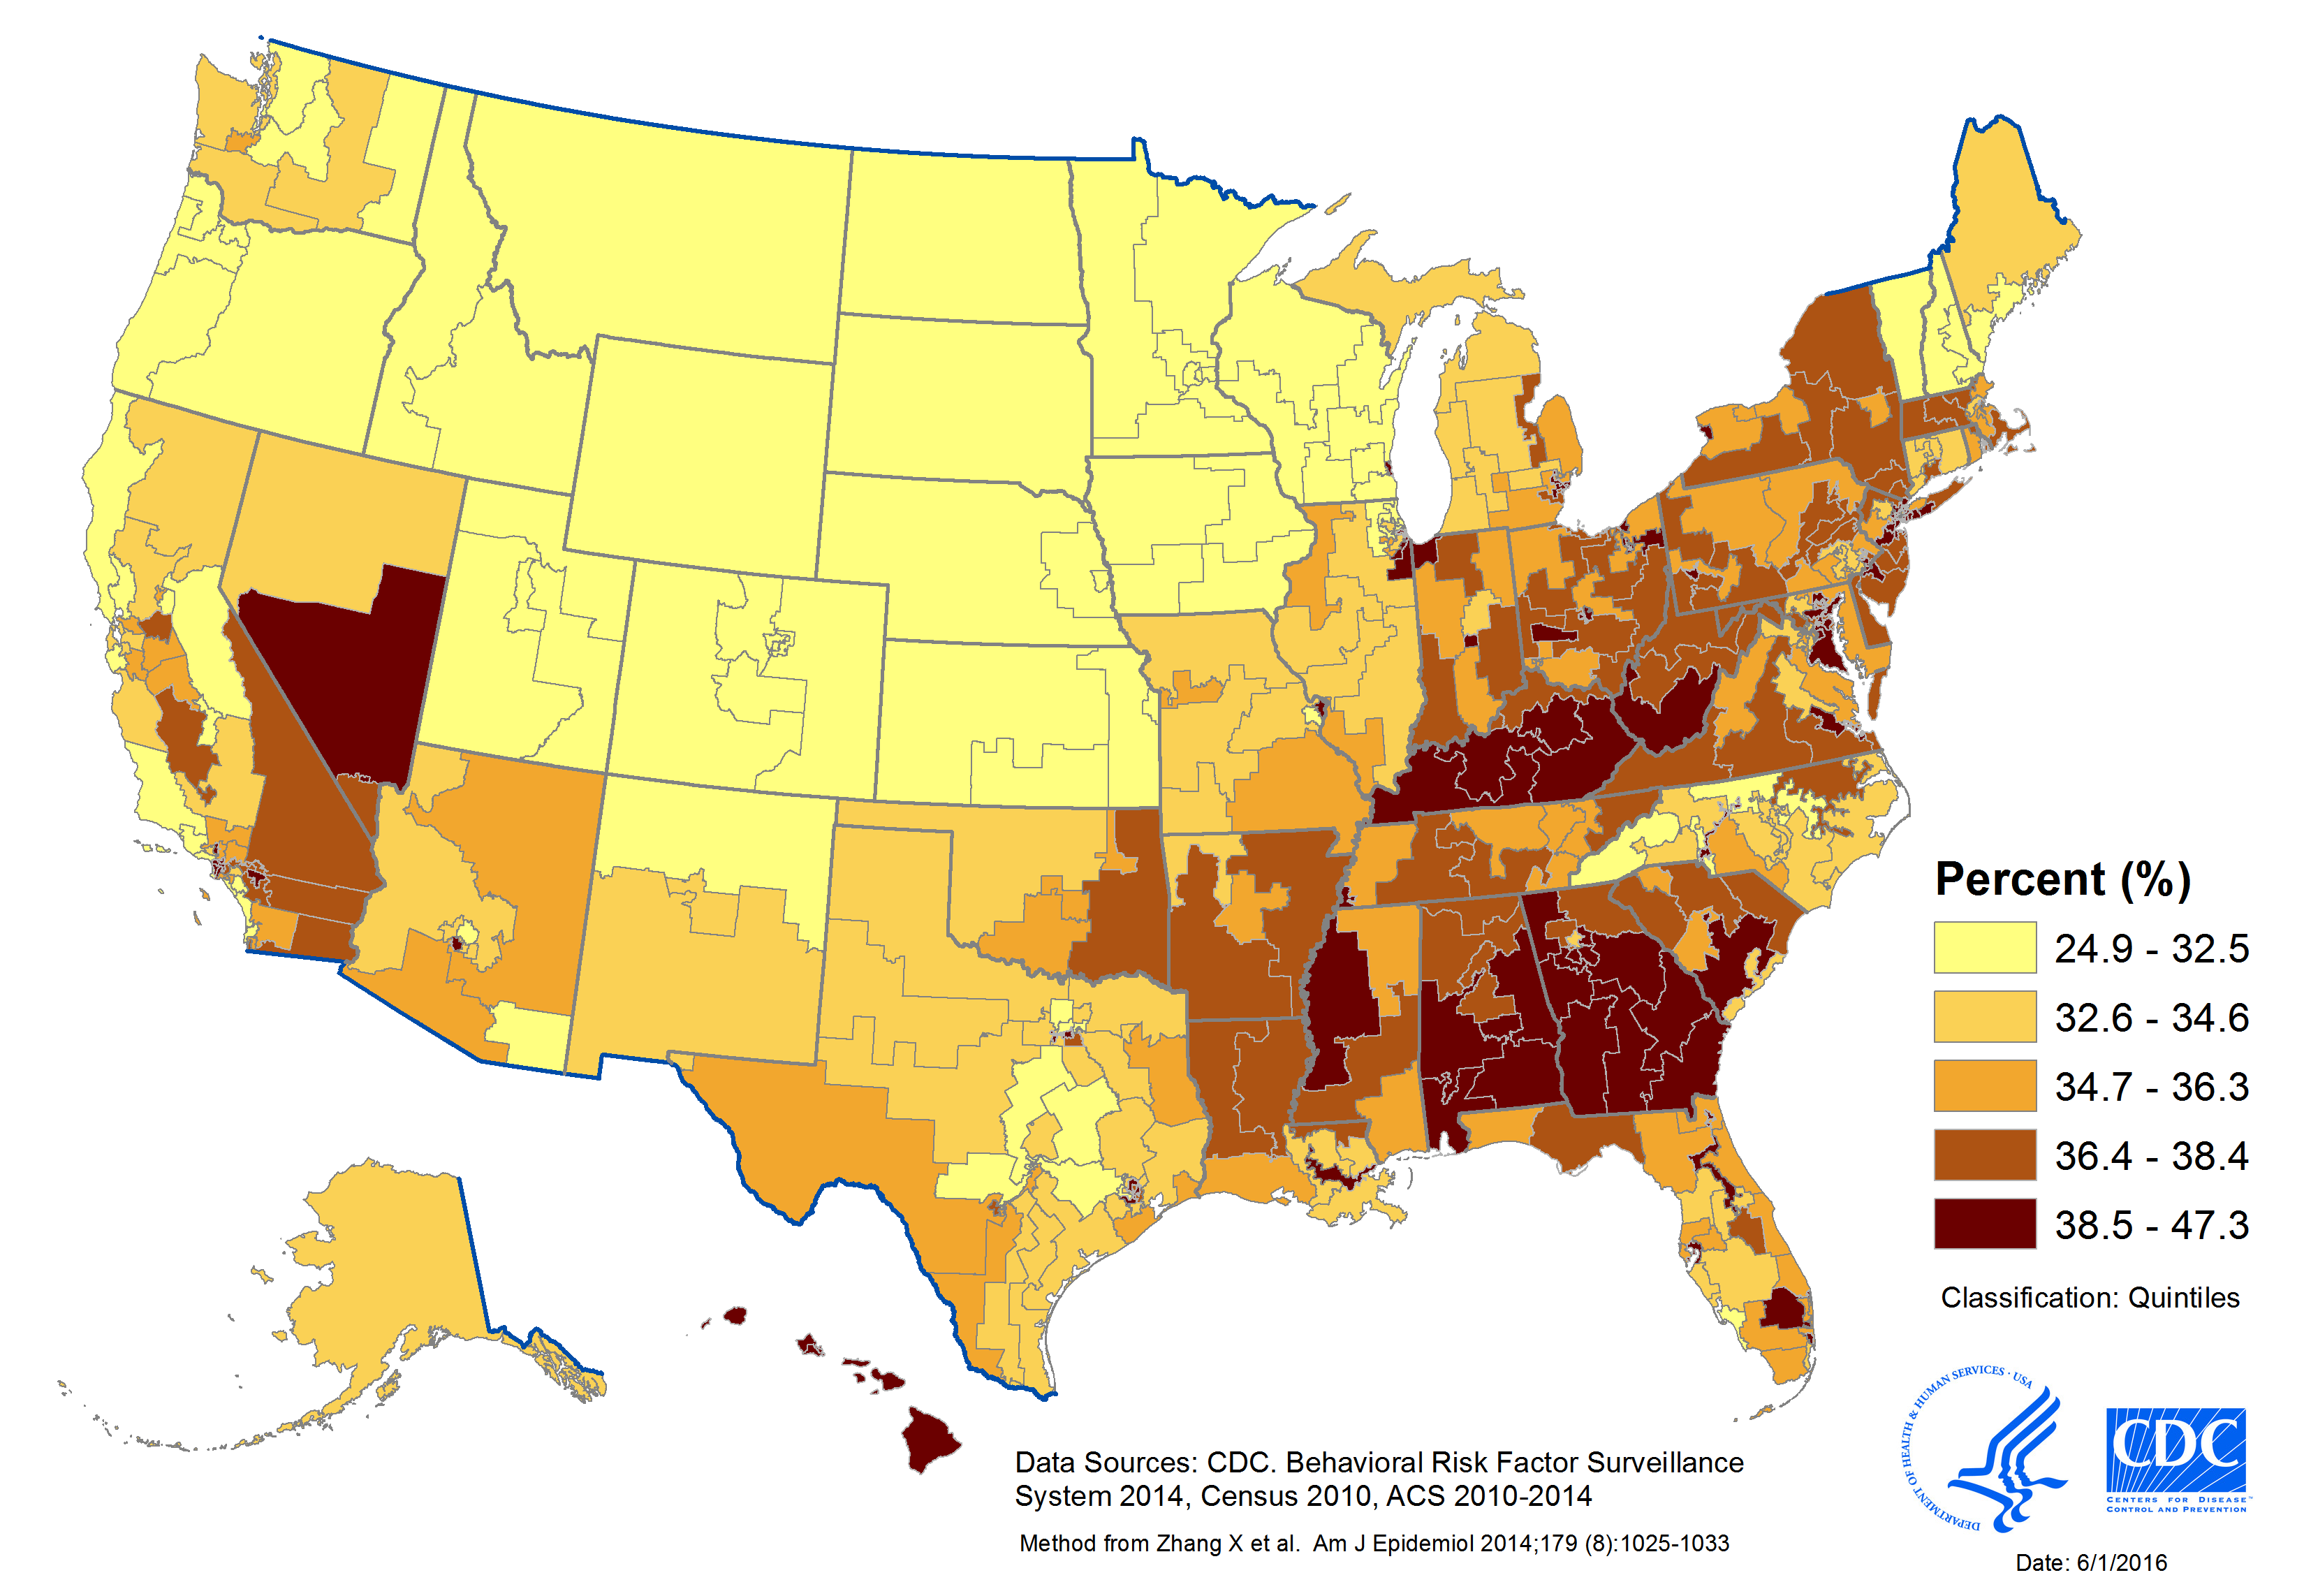
Figure 4. Prevalence of Short Sleep Duration (<7 hours) for Adults Aged ≥ 18 Years, by Census Tract, United States, 2014
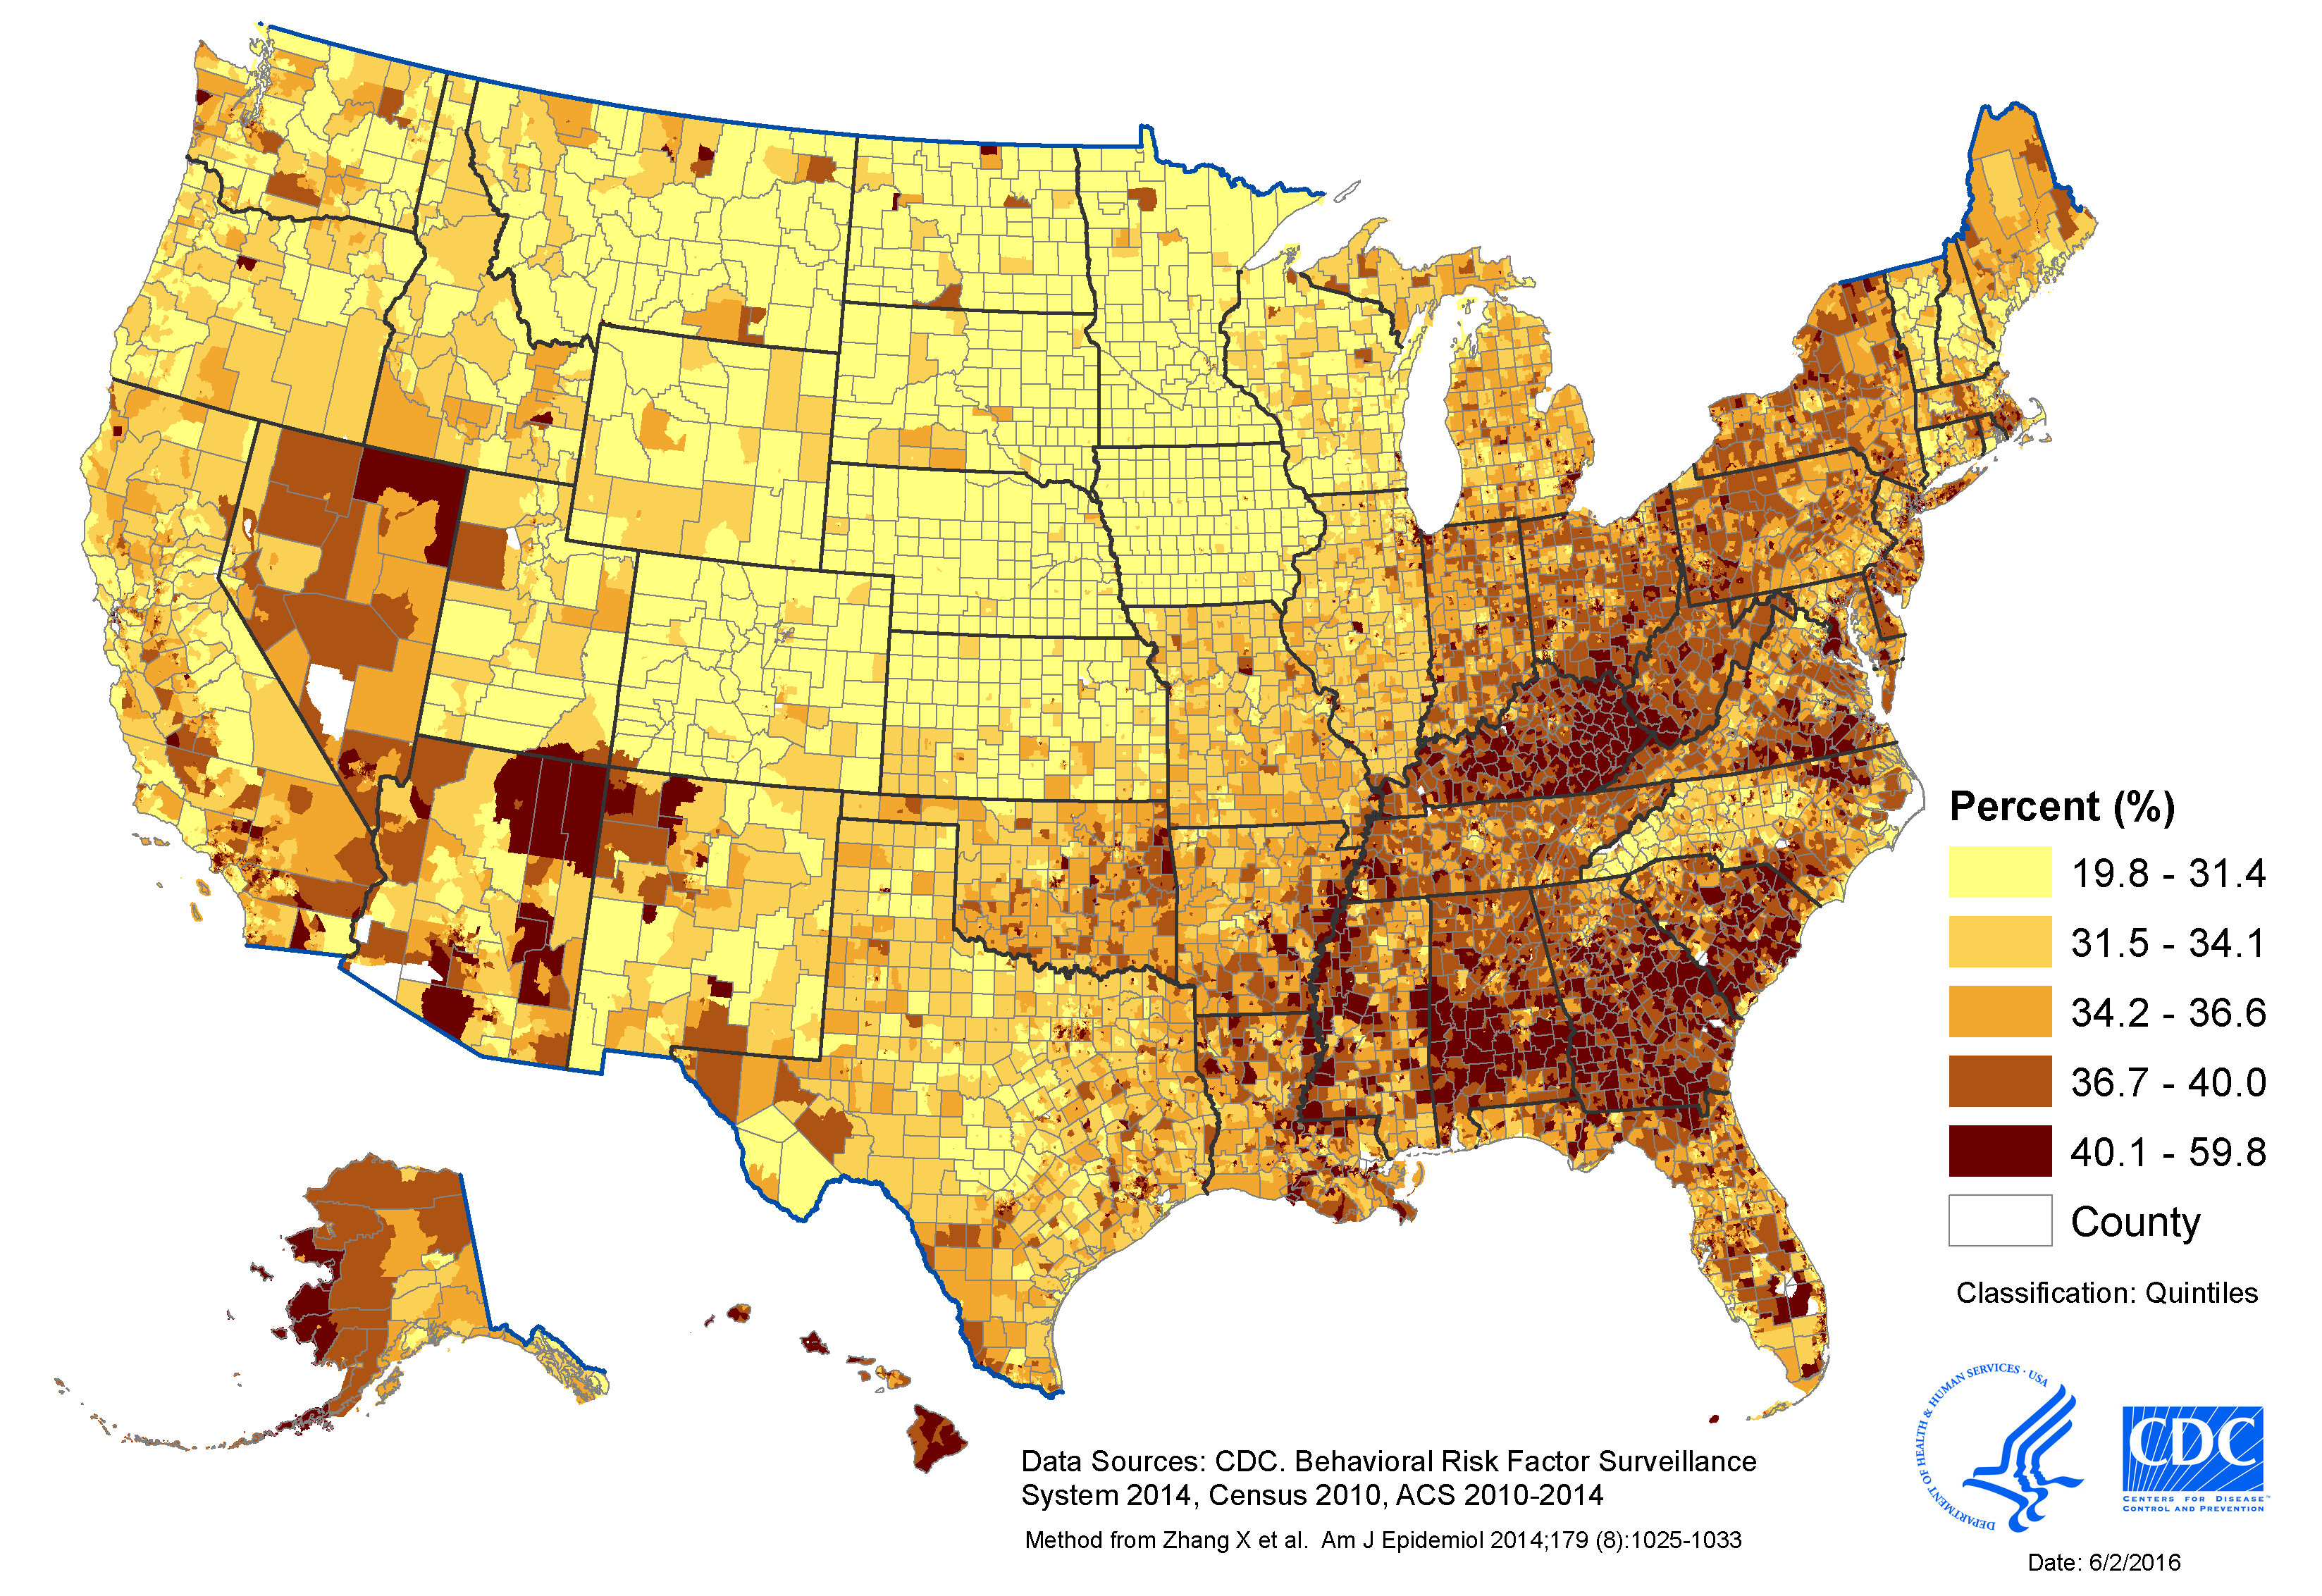
Explore the variation in short sleep duration by census tract at the 500 Cities: Local Data for Better Health website.
Short Sleep Duration by Sex, Age, and Race/Ethnicity
In 2014, short sleep duration (less than 7 hours) was less common among respondents aged ≥65 years (26.3%) compared with other age groups (see Table 1). The age-adjusted prevalence of short sleep duration was higher among Native Hawaiians/Pacific Islanders (46.3%), non-Hispanic blacks (45.8%), multiracial non-Hispanics (44.3%), and American Indians/Alaska Natives (40.4%) compared with non-Hispanic whites (33.4%), Hispanics (34.5%), and Asians (37.5%). Short sleep prevalence did not differ between men and women.
Table 1. Short Sleep Duration (<7 Hours) by Sex, Age, and Race/Ethnicity — Behavioral Risk Factor Surveillance System, United States, 2014
| Characteristic | % | 95% Confidence Interval |
|---|---|---|
| All Adultsa | 35.2 | (34.9–35.5) |
| Sexa | ||
| Men | 35.5 | (35.1–36.0) |
| Women | 34.8 | (34.4–35.2) |
| Age (Years) | ||
| 18–24 | 32.2 | (31.3–33.2) |
| 25–34 | 37.9 | (37.1–38.7) |
| 35–44 | 38.3 | (37.5–39.1) |
| 45–54 | 39.0 | (38.3–39.6) |
| 55–64 | 35.6 | (34.9–36.2) |
| ≥65 | 26.3 | (25.8–26.8) |
| Race/Ethnicitya | ||
| White | 33.4 | (33.0–33.7) |
| Hispanic | 34.5 | (33.6–35.5) |
| Black | 45.8 | (44.9–46.8) |
| Asian | 37.5 | (35.2–39.7) |
| American Indian/Alaska Native | 40.4 | (37.9–43.0) |
| Native Hawaiian/Pacific Islander | 46.3 | (39.9–52.8) |
| Other/Multiracial | 44.3 | (42.4–46.2) |
aAge-adjusted to the 2000 US standard population.
Health Risk Factors by Sleep Duration
Adults who were short sleepers (less than 7 hours of sleep per 24-hour period) were more likely to report being obese, physically inactive, and current smokers compared to people who got enough sleep (7 or more hours per 24-hour period) (see Table 2).
Table 2. Age-Adjusteda Percentage Reporting Health Risk Factors by Sleep Duration—Behavioral Risk Factor Surveillance System, United States, 2014
|
Short sleep |
Sufficient sleep |
||||
|---|---|---|---|---|---|
| Health risk factor | Definition | % | 95% CI | % | 95% CI |
| Obese | Body Mass Index ≥30 kg/m2 | 33.0 | (32.5–33.5) | 26.5 | (26.2–26.9) |
| Physically inactive | No leisure time physical activity in past 30 days | 27.2 | (26.8–27.7) | 20.9 | (20.6–21.2) |
| Current smoker | Currently smoke cigarettes every day or some days | 22.9 | (22.4–23.4) | 14.9 | (14.6–15.2) |
| Excessive alcohol | Underage drinker, binge drinker, or heavy drinkerb | 19.4 | (18.9–19.8) | 19.1 | (18.7–19.4) |
Abbreviations: CI = confidence interval.
aAge-adjusted to the 2000 US standard population.
bUnderage drinker is defined as any alcohol use among those aged 18–20 yrs. Binge drinker is defined as ≥4 drinks for women and ≥5 drinks for men during a single occasion. Heavy drinker is defined as ≥8 drinks for women and ≥15 drinks for men per week.
All differences statistically significant at p<0.05 except excessive alcohol.
Chronic Health Conditions by Sleep Duration
Adults who were short sleepers (less than 7 hours per 24-hour period) were more likely to report 10 chronic health conditions compared to those who got enough sleep (7 or more hours per 24-hour period) (see Table 3).
Table 3. Age-Adjusteda Percentage Reporting Chronic Health Conditions by Sleep Duration—Behavioral Risk Factor Surveillance System, United States, 2014
|
Short sleep |
Sufficient sleep |
|||
| Chronic condition | % | 95% CI | % | 95% CI |
| Heart attack | 4.8 | (4.6–5.0) | 3.4 | (3.3–3.5) |
| Coronary heart disease | 4.7 | (4.5–4.9) | 3.4 | (3.3–3.5) |
| Stroke | 3.6 | (3.4–3.8) | 2.4 | (2.3–2.5) |
| Asthma | 16.5 | (16.1–16.9) | 11.8 | (11.5–12.0) |
| COPD (chronic obstructive pulmonary disease) | 8.6 | (8.3–8.9) | 4.7 | (4.6–4.8) |
| Cancer | 10.2 | (10.0–10.5) | 9.8 | (9.7–10.0) |
| Arthritis | 28.8 | (28.4–29.2) | 20.5 | (20.2–20.7) |
| Depression | 22.9 | (22.5–23.3) | 14.6 | (14.3–14.8) |
| Chronic kidney disease | 3.3 | (3.1–3.5) | 2.2 | (2.1–2.3) |
| Diabetes | 11.1 | (10.8–11.4) | 8.6 | (8.4–8.8) |
Abbreviations: CI = confidence interval.
aAge-adjusted to the 2000 US standard population.
The prevalence of each condition is significantly higher (p<0.05) for persons reporting short sleep compared with those reporting sufficient sleep.
Links for sleep data:
Chronic Disease Indicators: prevalence of sufficient sleep among adults (Category: Overarching Conditions)
County Health Rankings: prevalence of insufficient sleep among adults (Measures: Health Behaviors)
State Fact Sheets: State-specific maps and data on short sleep duration.
Short Sleep Duration Among High School Students
Adolescents need 8 to 10 hours of sleep per night.3 But, more than two-thirds of US high school students report getting less than 8 hours of sleep on school nights (see Table 4).4 Female students are more likely to report not getting enough sleep than male students. Short sleep duration (<8 hours) is lowest among 9th graders and highest among 12th graders. Prevalence of short sleep duration also varies by race/ethnicity, with the lowest prevalence among American Indian/Alaska Native students and the highest among Asian students.
Table 4. Short Sleep Duration by Selected Characteristics—
Youth Risk Behavior Survey, United States, 2007–2013.
| Short sleep duration (<8 hours) | ||
| Characteristic | %a | 95% Confidence Interval |
| Total | 68.8 | (68.0–69.6) |
| Survey year | ||
| 2007 | 69.0 | (67.0–70.9) |
| 2009 | 69.1 | (67.5–70.6) |
| 2011 | 68.6 | (67.2–69.9) |
| 2013 | 68.4 | (66.9–69.9) |
| Sex | ||
| Female | 71.3 | (70.4–72.1) |
| Male | 66.4 | (65.4–67.4) |
| Grade | ||
| 9th | 59.7 | (58.6–60.8) |
| 10th | 67.4 | (66.1–68.8) |
| 11th | 73.3 | (72.0–74.5) |
| 12th | 76.6 | (75.4–77.8) |
| Race/ethnicity | ||
| Whiteb | 68.3 | (67.3–69.4) |
| Blackb | 71.2 | (69.9–72.5) |
| Hispanic | 67.0 | (65.5–68.5) |
| American Indian/Alaska Nativeb | 60.3 | (52.4–67.6) |
| Asianb | 75.7 | (72.7–78.5) |
| Native Hawaiian/Pacific Islanderb | 68.3 | (62.1–73.9) |
| Multiracialb | 72.0 | (69.2–74.7) |
aWeighted percentages.
bNon-Hispanic.
References
- Watson NF, Badr MS, Belenky G, et al.; Consensus Conference Panel. Joint consensus statement of the American Academy of Sleep Medicine and Sleep Research Society on the recommended amount of sleep for a healthy adult: methodology and discussion. Sleep. 2015;38:1161–1183.
- Zhang X, Holt JB, Lu H, et al. Multilevel regression and poststratification for small area estimation of population health outcomes: a case study of chronic obstructive pulmonary disease prevalence using BRFSS. Am J Epidemiol. 2014;179(8):1025-1033.
- Paruthi S, Brooks LJ, D’Ambrosio C, et al. Recommended amount of sleep for pediatric populations: a consensus statement of the American Academy of Sleep Medicine. J Clin Sleep Med. 2016;12(6):785–786.
- Wheaton AG, Olsen EO, Miller GF, Croft JB. Sleep duration and injury-related risk behaviors among high school students — United States, 2007–2013. MMWR Morb Mortal Wkly Rep. 2016;65:337–341. https://www.cdc.gov/mmwr/volumes/65/wr/mm6513a1.htm
- Page last reviewed: May 2, 2017
- Page last updated: May 2, 2017
- Content source: