

How do I embed a visualization that I just created?
 ShareCompartir
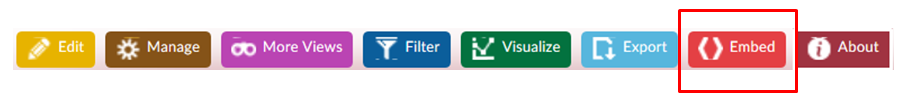
Embedding a visualization in a blog or website
As a user of the Tobacco Use Data Portal, you are able to imbed visualizations from Socrata into a blog or website.
To embed a chart, map, table, or other visualization, click on the Embed button at the top right-hand side of the dataset.
This button will then generate an embed code that a user can copy and paste into a blog or webiste.
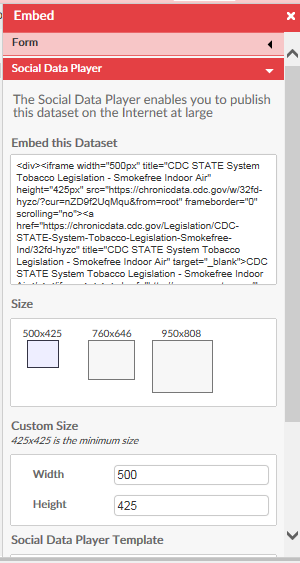
A user can adjust the size of the embedded object by clicking on the three boxes under "Size" or can create a custom sized image under "Custom Size".


- Page last reviewed: January 13, 2015
- Page last updated: January 13, 2015
- Content source: