

How can I create a map from a filtered view?
 ShareCompartir
How can I create a map from a filtered view?
You can create custom visuals about the data with your chosen dataset.
Step 1: Follow the steps to create a filtered view from “How do I create my own filtered view?”
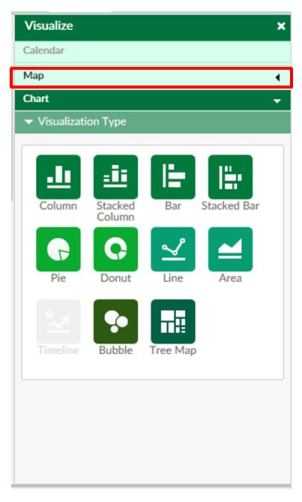
Step 2: After saving your view, click on the Visualize button
Step 3: Select the Map option
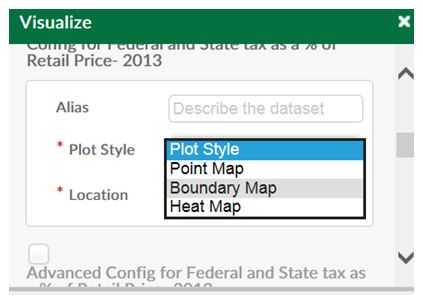
Step 4: Under plot style you will want to choose “Boundary Map”
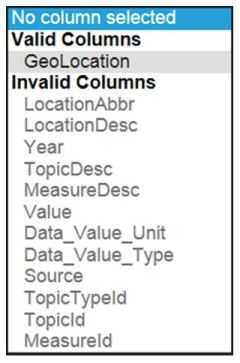
Step 5: Under Location > Valid Columns, select GeoLocation
Step 6: Select the checkbox for Advanced Configuration for *Title of View*
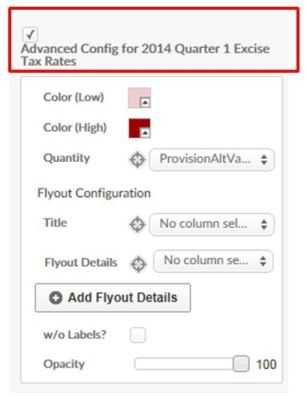
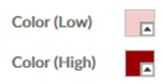
Step 7: Under the “Advanced Configuration” box you must:
- Assign colors to represent high and low values in your map
- Choose the column of values you wish to map
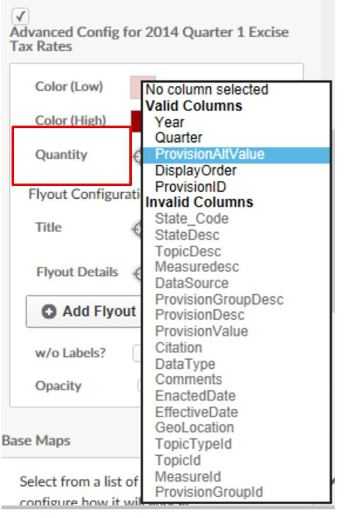
- Choose the flyout details that will be displayed when a state is clicked on
- For example, if you would like the name of the state to appear in the flyout details, under “Title” you would choose the column “Location Description” which is the column which has the names of the states.
Step 8: If you would like to see a blank background for your maps, click the minus button next to Layer under the box “Base Maps”
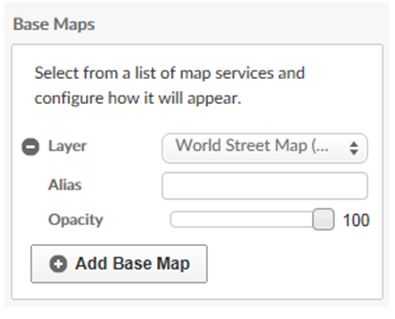
*Note: if you would like to have a base map, choose one from the drop down menu next to “Layer”
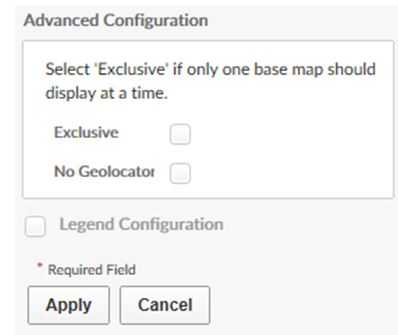
Step 9: When all of your selections have been made, click on the Apply button at the bottom of the page:


- Page last reviewed: January 13, 2015
- Page last updated: January 13, 2015
- Content source: