

U.S. Teenage Birth Rate Resumes Decline
 ShareCompartir
On This Page
- Key findings
- The birth rate for U.S. teenagers fell in 2009 to the lowest level ever reported.
- Recent declines in teenage birth rates have occurred for younger and older teenagers.
- Birth rates for teenagers aged 15-17 have fallen since 1991 for all racial and ethnic groups.
- Birth rates for teenagers aged 18-19 fell in 2009 for all racial and ethnic groups.
- Birth rates for young teenagers aged 15-17 declined in 31 states during 2007-2009.
- Birth rates for older teenagers aged 18-19 fell in 45 states from 2007 through 2009.
- Summary
- Definition
- Data source and methods
- About the authors
- References
- Suggested citation
NCHS Data Brief No. 58, February 2011
PDF Version (595 KB)
Stephanie J. Ventura, M.A., and Brady E. Hamilton, Ph.D.
Key findings
Data from the Natality Data File, National Vital Statistics System
- The teenage birth rate declined 8 percent in the United States from 2007 through 2009, reaching a historic low at 39.1 births per 1,000 teens aged 15-19 years.
- Rates fell significantly for teenagers in all age groups and for all racial and ethnic groups.
- Teenage birth rates for each age group and for nearly all race and Hispanic origin groups in 2009 were at the lowest levels ever reported in the United States.
- Birth rates for teens aged 15-17 dropped in 31 states from 2007 through 2009; rates for older teenagers aged 18-19 declined significantly in 45 states during this period.
Teenage childbearing has been the subject of long-standing concern among the public and policy makers. Teenagers who give birth are much more likely to deliver a low birthweight or preterm infant than older women (1,2), and their babies are at elevated risk of dying in infancy (3). The annual public costs associated with teen childbearing have been estimated at $9.1 billion (4). The U.S. teen birth rate fell by more than one-third from 1991 through 2005, but then increased by 5 percent over two consecutive years. Data for 2008 and 2009, however, indicate that the long-term downward trend has resumed (1,5). Although the recent declines have been widespread by age, race and ethnicity, and state, large disparities nevertheless persist in these characteristics (6,7). The most current data available from the National Vital Statistics System are used to illustrate trends and variations through 2009.
Keywords: birth, teenage birth rates, race and Hispanic origin, state rates
The birth rate for U.S. teenagers fell in 2009 to the lowest level ever reported.
- The U.S. birth rate for teenagers in 2009 was the lowest it has ever been in the nearly 70 years for which national data are available (1,5,8) (Figure 1). The rate was 39.1 births per 1,000 females aged 15-19 years, 37 percent below the 1991 rate (61.8), the most recent peak (8).
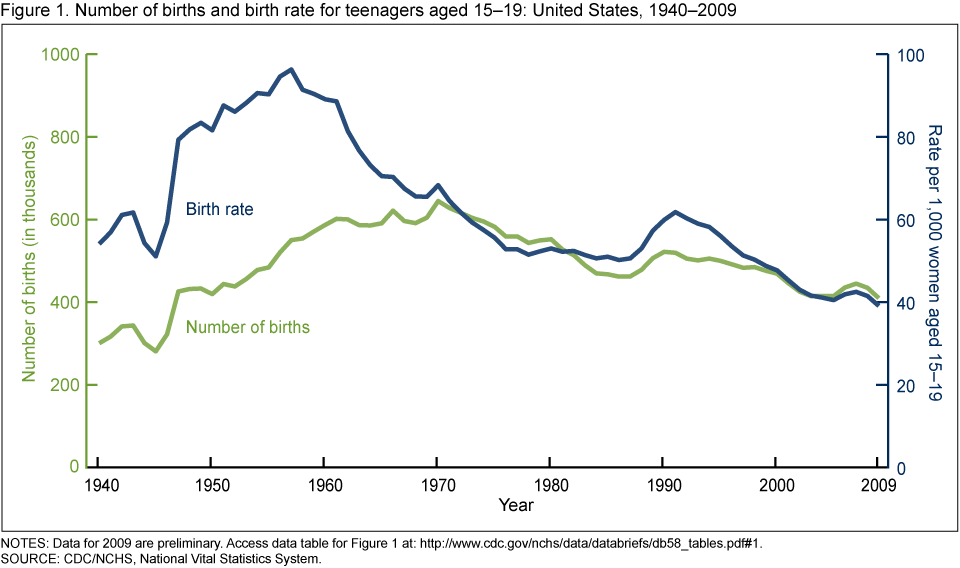
NOTES: Data for 2009 are preliminary. Access data table for Figure 1 [PDF – 60 KB].
SOURCE: CDC/NCHS, National Vital Statistics System.
- The teenage birth rate in 2009 was 59 percent lower than the historic high reached in 1957 (96.3) (8).
- The number of births to teenagers aged 15-19 in 2009 fell to 409,840, the fewest since 1946 and 36 percent fewer than in 1970 (644,708), the historic high point.
Recent declines in teenage birth rates have occurred for younger and older teenagers.
- The birth rate for young teenagers aged 15-17 fell 7 percent in 2009 from 2008, the largest single-year drop since 2000-2001 (1,8) (Figure 2). The 2009 rate (20.1 per 1,000), a historic low, was 48 percent lower than in 1991 (38.6 per 1,000).
- The birth rate for older teenagers aged 18-19 fell 6 percent from 2008 through 2009, the largest single-year decline since 1971-1972 (1,5,8). The 2009 rate, also a historic low at 66.2 per 1,000, was 30 percent lower than in 1991 (94.0).
- Births and birth rates for the youngest teenagers, under age 15, have also declined over the last half-century (see Table [PDF – 15 KB]). The 2009 birth rate for females aged 10-14 was 0.5 births per 1,000, the lowest ever reported and two-thirds lower than in 1990 (1.4). Moreover, the number of babies born to this age group has fallen to the fewest in nearly 60 years, to 5,030 in 2009.
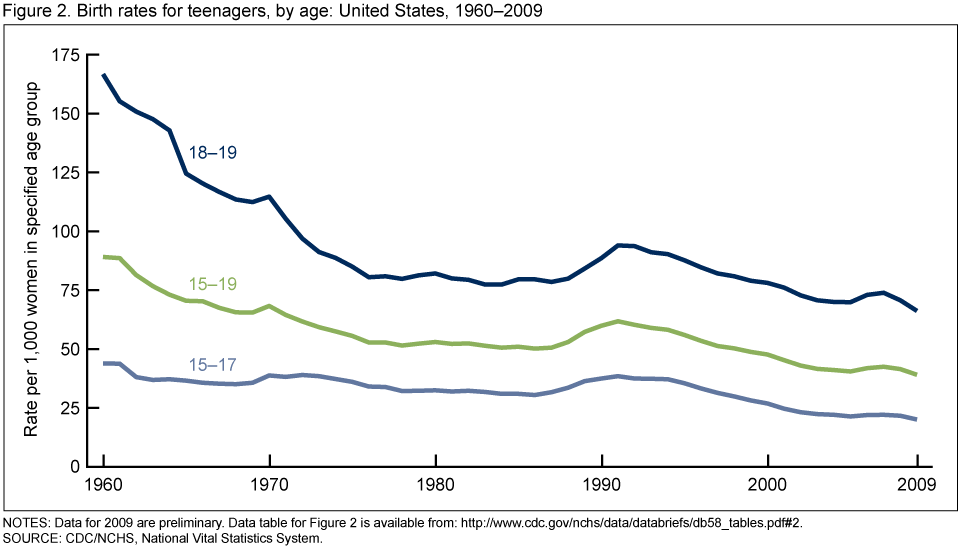
NOTES: Data for 2009 are preliminary. Access data table for Figure 2 [PDF – 60 KB].
SOURCE: CDC/NCHS, National Vital Statistics System.
Birth rates for teenagers aged 15-17 have fallen since 1991 for all racial and ethnic groups.
- Birth rates for white and black non-Hispanic teenagers and Asian or Pacific Islander (API) teenagers aged 15-17 dropped 53 percent to 63 percent from 1991 through 2009 (Figure 3).
- Although the birth rate for Hispanic teenagers declined more slowly overall from 1991 through 2009, the decline in the rate from 2008 to 2009 (41.0 per 1,000) was the largest of all race and ethnicity groups (by 11 percent).
- Further, the rate for Hispanic teenagers in 2009 was the lowest ever recorded in the 2 decades for which rates are available for this group (1,5).
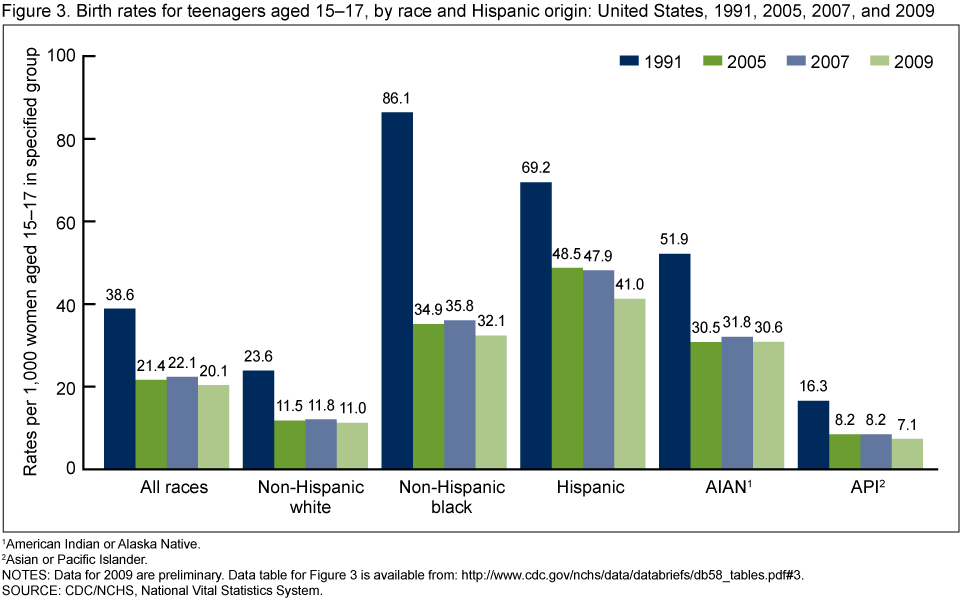
1American Indian or Alaska Native.
2Asian or Pacific Islander.
NOTES: Data for 2009 are preliminary. Access data table for Figure 3 [PDF – 60 KB].
SOURCE: CDC/NCHS, National Vital Statistics System.
Birth rates for teenagers aged 18-19 fell in 2009 for all racial and ethnic groups.
- Birth rates overall and by race and ethnicity are consistently higher for ages 18-19 than for ages 15-17. Although the downward trend for both age groups has been similar, long-term declines were smaller for older teenagers.
- From 1991 through 2009, rates for all racial and ethnic groups for ages 18-19 dropped by 27 percent to 40 percent. Single-year declines for all groups from 2008 to 2009 ranged from 5 percent to 10 percent (5) (Figure 4).
- Birth rates in 2009 for non-Hispanic white (46.1 per 1,000), non-Hispanic black (97.5), and API teenagers (25.7) were the lowest ever reported for these groups. Similarly, the 2009 rate for Hispanic teenagers aged 18-19 was a record low (114.0).
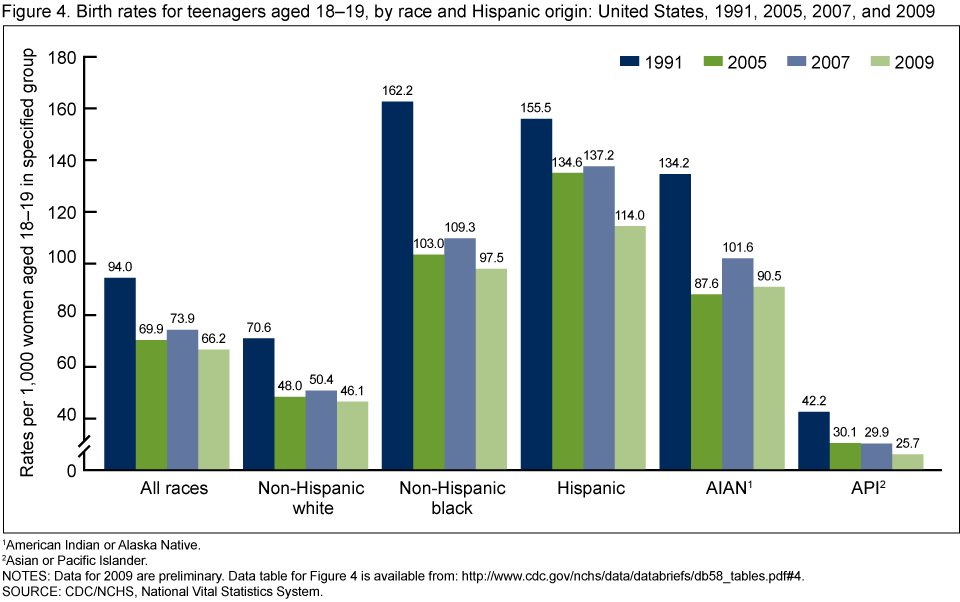
1American Indian or Alaska Native.
2Asian or Pacific Islander.
NOTES: Data for 2009 are preliminary. Access data table for Figure 4 [PDF – 60 KB].
SOURCE: CDC/NCHS, National Vital Statistics System.
Birth rates for young teenagers aged 15-17 declined in 31 states during 2007-2009.
- Birth rates for teenagers aged 15-17 fell significantly in most areas of the country from 2007 through 2009, the most recent period of decline for teen birth rates (Figure 5).
- The largest declines were in the intermountain West and southeast areas of the United States. The decline in rates ranged from 5 percent for Ohio to 20 percent for Arizona.
- The rate increased significantly for only one state from 2007 through 2009, West Virginia, by 17 percent.
NOTES: Data for 2009 are preliminary. Access data table for Figure 5 [PDF – 60 KB].
SOURCE: CDC/NCHS, National Vital Statistics System.
Birth rates for older teenagers aged 18-19 fell in 45 states from 2007 through 2009.
- Birth rates fell for ages 18-19 from 2007 through 2009 in the majority of states (Figure 6). The largest declines were reported for the intermountain West and northern New England states.
- The range of decline was from 5 percent for New York, Louisiana, and New Mexico to 27 percent for New Hampshire and Vermont.
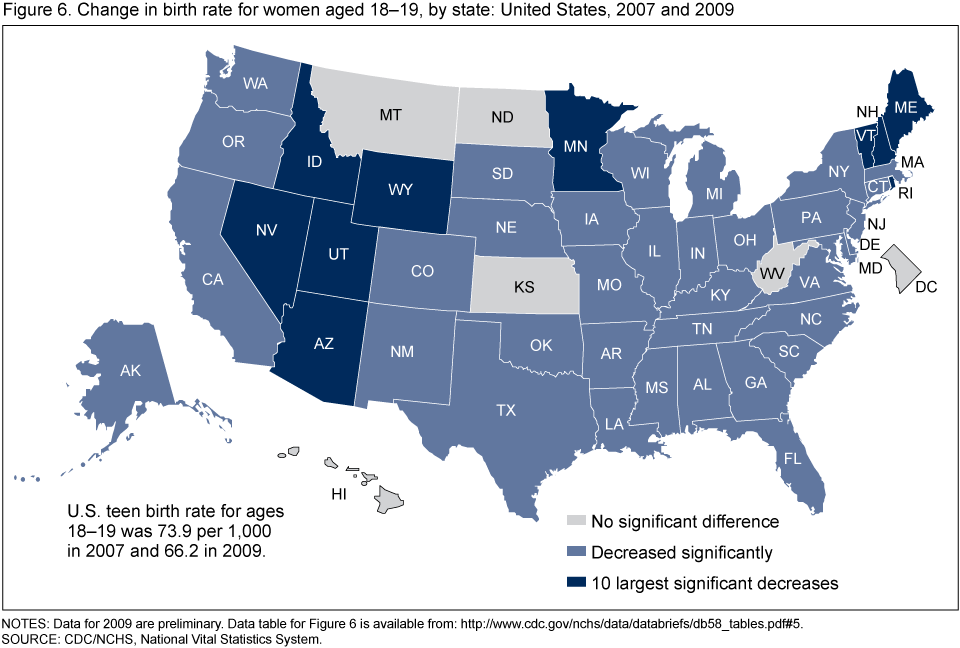
NOTES: Data for 2009 are preliminary. Access data table for Figure 6 [PDF – 60 KB].
SOURCE: CDC/NCHS, National Vital Statistics System.
Summary
The U.S. teenage birth rate reached a historic low in 2009, at 39.1 births per 1,000 women aged 15-19. While the U.S. teenage birth rate fell 37 percent from 1991 through 2009, it still remains the highest among industrialized countries (9). Rates in the United States fell from 2007 through 2009 by age subgroup, race and Hispanic origin, and state. The recent trend marks a resumption of the long-term decline in teenage childbearing that started in 1991. Previous studies have suggested that these declines reflected the impact of strong teenage pregnancy prevention messages that accompanied a variety of public and private efforts to focus teenagers’ attention on the importance of avoiding pregnancy (10-12). Data from several cycles of the National Survey of Family Growth (NSFG) conducted by the Centers for Disease Control and Prevention’s National Center for Health Statistics (CDC/NCHS) showed that teen sexual activity declined or leveled off in the 1990s through the mid-2000s, and that contraceptive use increased or stabilized (13). Data from the 2006-2010 NSFG, forthcoming in 2011, may be helpful in identifying the factors associated with the declines in teenage birth rates.
Definition
Teenage birth rate: The number of births to women aged 15-19 (or teenage subgroup) per 1,000 women aged 15-19 (or teenage subgroup).
Data source and methods
This report contains data from the Natality Data File, National Vital Statistics System. The vital statistics natality file includes information for all births occurring in the United States. The natality files, which cover a wide range of maternal and infant demographic and health characteristics, are available from Vital Statistics Online. Data may also be accessed using the interactive data access tool VitalStats.
State-specific birth rates for teenagers for 2009 are based on preliminary birth data. Information on the 2009 data is available elsewhere (5). Population data for computing birth rates were provided by the U.S. Census Bureau. Rates by state shown here may differ from rates computed on the basis of other population estimates (1,14). A forthcoming report will focus on recent changes in birth rates for older women (15).
About the authors
Stephanie J. Ventura and Brady E. Hamilton are with CDC/NCHS, Division of Vital Statistics, Reproductive Statistics Branch. Elizabeth Wilson, also with the Reproductive Statistics Branch, provided table and figure verification.
References
- Martin JA, Hamilton BE, Sutton PD, et al. Births: Final data for 2008. National vital statistics reports; vol 59 no 1. Hyattsville, MD: National Center for Health Statistics. 2010.
- Martin JA, Osterman MJK, Sutton PD. Are preterm births on the decline in the United States? Recent data from the National Vital Statistics System. NCHS data brief, no 39. Hyattsville, MD: National Center for Health Statistics. 2010.
- Mathews TJ, MacDorman MF. Infant mortality statistics from the 2006 period linked birth/infant death data set. National vital statistics reports; vol 58 no 17. Hyattsville, MD: National Center for Health Statistics. 2010.
- Hoffman SD. By the numbers: The public costs of teen childbearing. Washington, DC: The National Campaign to Prevent Teen Pregnancy. 2006.
- Hamilton BE, Martin JA, Ventura SJ. Births: Preliminary data for 2009. National vital statistics reports; vol 59 no 3. Hyattsville, MD: National Center for Health Statistics. 2010.
- Mathews TJ, Sutton PD, Hamilton BE, Ventura SJ. State disparities in teenage birth rates in the United States. NCHS data brief, no 46. Hyattsville, MD: National Center for Health Statistics. 2010.
- Ventura SJ, Mathews TJ, Hamilton BE, et al. Adolescent pregnancy and childbirth-United States, 1991-2008. In: CDC health disparities and inequalities report-United States, 2011 [PDF – 3 MB]. MMWR 60(Suppl):105-8. 2011.
- Ventura SJ, Mathews TJ, Hamilton BE. Births to teenagers in the United States, 1940-2000. National vital statistics reports; vol 49 no 10. Hyattsville, MD: National Center for Health Statistics. 2001.
- United Nations Statistics Division. Demographic yearbook 2008. New York, NY: United Nations. 2009.
- National Campaign to Prevent Teen and Unplanned Pregnancy. National data. Washington, DC: National Campaign to Prevent Teen Pregnancy. Accessed November 28, 2010.
- Kirby D. Emerging answers 2007: Research findings on programs to reduce teen pregnancy and sexually transmitted diseases. Washington, DC: National Campaign to Prevent Teen and Unplanned Pregnancy. 2007.
- Oringanje C, Meremikwu MM, Eko H, Esu E, Meremikwu A, Ehiri JE. Interventions for preventing unintended pregnancies among adolescents. Cochrane Database Syst Rev (4):CD005215. 2009.
- Abma JC, Martinez GM, Copen CE. Teenagers in the United States: Sexual activity, contraceptive use, and childbearing, National Survey of Family Growth 2006-2008. National Center for Health Statistics. Vital Health Stat 23(30). 2010.
- Hamilton BE, Sutton PD, Ventura SJ. Revised birth and fertility rates for the 1990s and new rates for Hispanic populations, 2000 and 2001: United States. National vital statistics reports; vol 51 no 12. Hyattsville, MD: National Center for Health Statistics. 2003.
- Sutton PD, Hamilton BE, Mathews TJ. Recent declines in births in the United States, 2007-2009. NCHS data brief. Hyattsville, MD: National Center for Health Statistics. Forthcoming. 2011.
Suggested citation
Ventura SJ, Hamilton BE. U.S. teenage birth rate resumes decline. NCHS data brief, no 58. Hyattsville, MD: National Center for Health Statistics. 2011.
Copyright information
All material appearing in this report is in the public domain and may be reproduced or copied without permission; citation as to source, however, is appreciated.
National Center for Health Statistics
Edward J. Sondik, Ph.D., Director
Jennifer H. Madans, Ph.D., Associate Director for Science
Division of Vital Statistics
Charles J. Rothwell, M.S., Director
- Page last reviewed: November 6, 2015
- Page last updated: February 2, 2010
- Content source: