Young Adults Seeking Medical Care: Do Race and Ethnicity Matter?
On This Page
- Key findings
- Does health insurance coverage differ by race and ethnicity for young adults?
- Does access to medical care differ by race and ethnicity for young adults?
- Does having a doctor visit in the past year differ by race and ethnicity for young adults?
- Does emergency room use differ by race and ethnicity for young adults?
- Does unmet medical need differ by race and ethnicity for young adults?
- Summary
- Definitions
- Data source and methods
- About the authors
- References
- Suggested citation
NCHS Data Brief No. 55, January 2011
PDF Version (515 KB)
Barbara Bloom, M.P.A. and Robin A. Cohen, Ph.D.
Key findings
Data from the National Health Interview Survey: 2008–2009
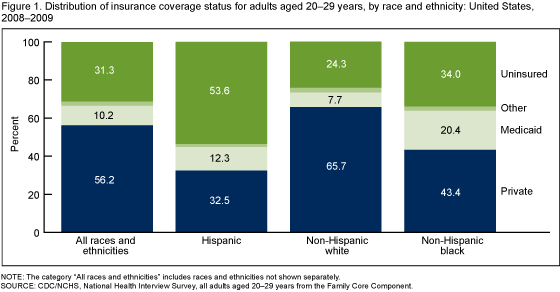
- More than one-half of Hispanic young adults aged 20–29 years were uninsured in 2008–2009 compared with one-third of non-Hispanic black young adults and almost one-quarter of non-Hispanic white young adults.
- Among young adults aged 20–29 years, non-Hispanic white (66%) young adults were twice as likely as Hispanic (33%) young adults to have private health insurance coverage.
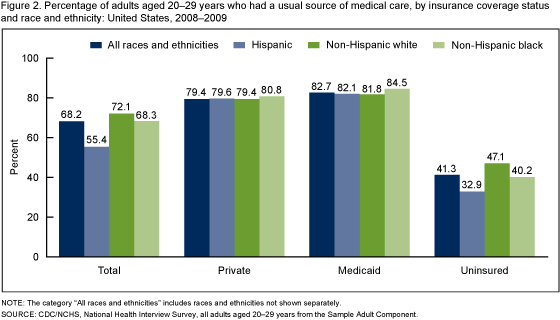
- Approximately equal percentages of Hispanic, non-Hispanic white, and non-Hispanic black young adults with private health insurance or Medicaid had a usual source of medical care.
- Uninsured non-Hispanic white (37%) and non-Hispanic black (33%) young adults were more likely to have unmet medical need than uninsured Hispanic (21%) young adults.
Health care disparities among different racial and ethnic subgroups in the United States are of national concern. Health insurance is a key factor in the access to medical care services, and young adults in the United States aged 20–29 years are more likely than adults aged 30 years and over to lack health insurance coverage (1-4). A previous report has examined the differences in health insurance and access to health care by gender among young adults aged 20–29 years (5). This report focuses on the differences in health insurance and access to health care among Hispanic, non-Hispanic white, and non-Hispanic black young adults aged 20–29 years.
Keywords: health insurance, access to medical care, National Health Interview Survey
Does health insurance coverage differ by race and ethnicity for young adults?
- More than one-half of Hispanic young adults aged 20–29 years were uninsured in 2008–2009 compared with one-third of non-Hispanic black young adults and almost one-quarter of non-Hispanic white young adults (Figure 1).
- Non-Hispanic white (66%) young adults were twice as likely as Hispanic (33%) young adults and one and one-half times as likely as non-Hispanic black (43%) young adults to have private health insurance coverage.
- Non-Hispanic black (20%) young adults were more likely to have Medicaid coverage than Hispanic (12%) young adults or non-Hispanic white (8%) young adults.
Does access to medical care differ by race and ethnicity for young adults?
- Hispanic (55%) young adults aged 20–29 years were less likely to have had a usual source of medical care than non-Hispanic black (68%) or non-Hispanic white (72%) young adults (Figure 2 ).
- Approximately equal percentages of Hispanic, non-Hispanic white, and non-Hispanic black young adults had a usual source of medical care, for those with private health insurance (79%–81%) or Medicaid (82%–85%).
- Among uninsured young adults, non-Hispanic white (47%) and non-Hispanic black (40%) young adults were more likely to have had a usual source of medical care than Hispanic (33%) young adults.
Does having a doctor visit in the past year differ by race and ethnicity for young adults?
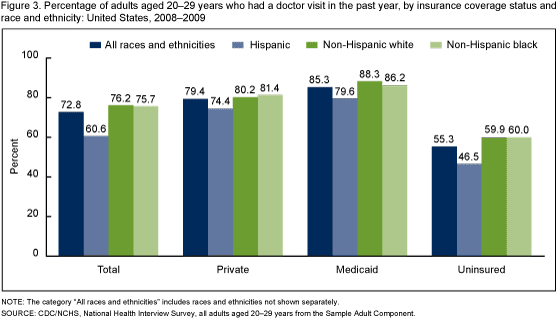
- Overall, non-Hispanic white (76%) and non-Hispanic black (76%) young adults aged 20–29 years were more likely to have had a doctor visit in the past year than Hispanic (61%) young adults (Figure 3).
- Non-Hispanic white (80%) and non-Hispanic black (81%) young adults with private insurance were more likely to have had a doctor visit in the past year than Hispanic (74%) young adults with the same coverage.
- Non-Hispanic white young adults with Medicaid (88%) were more likely to have had a doctor visit in the past year than Hispanic young adults with the same coverage (80%).
- Uninsured non-Hispanic white (60%) and non-Hispanic black (60%) young adults were more likely to have had a doctor visit in the past year than uninsured Hispanic (47%) young adults.
Does emergency room use differ by race and ethnicity for young adults?
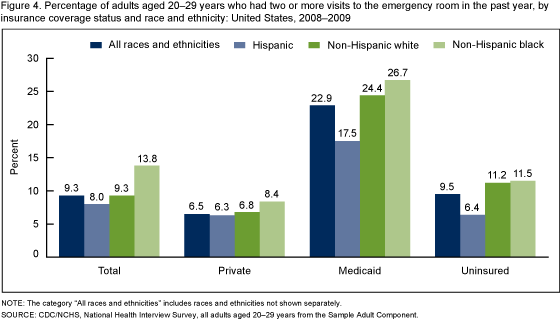
- Overall, non-Hispanic black (14%) young adults aged 20–29 years were more likely than non-Hispanic white (9%) or Hispanic (8%) young adults to have had two or more emergency room visits in the past year (Figure 4).
- Among young adults with private health insurance, approximately equal percentages of Hispanic (6%), non-Hispanic white (7%), and non-Hispanic black (8%) young adults had two or more emergency room visits in the past year.
- Non-Hispanic black young adults with Medicaid (27%) were more likely to have had two or more emergency room visits in the past year than Hispanic young adults with the same coverage (18%).
- Uninsured non-Hispanic white (11%) and non-Hispanic black (12%) young adults were about twice as likely to have had two or more emergency room visits in the past year as uninsured Hispanic (6%) young adults.
Does unmet medical need differ by race and ethnicity for young adults?
- Overall, non-Hispanic white (17%) or non-Hispanic black (18%) young adults aged 20–29 years were more likely to have had unmet medical need due to cost in the past year than Hispanic (15%) young adults (Figure 5).
- Among young adults with private insurance, non-Hispanic white (10%) young adults were more likely than Hispanic (8%) young adults to have had unmet medical need due to cost.
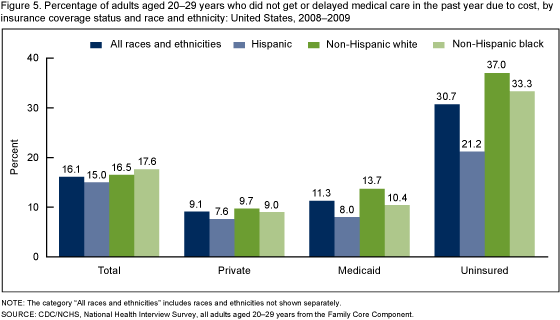
- Non-Hispanic white young adults with Medicaid (14%) were more likely to have had unmet medical need due to cost than Hispanic young adults with Medicaid (8%).
- Uninsured non-Hispanic white (37%) and non-Hispanic black (33%) young adults were more likely to have had unmet medical need than uninsured Hispanic (21%) young adults.
Summary
Hispanic young adults were less likely than black or white young adults to have health insurance coverage. Since coverage affords access to the health care system, it is not surprising that Hispanic young adults were less likely than non-Hispanic white or black young adults to have had a usual source of medical care or to have had a doctor visit in the past year.
Insured young adults were more likely than uninsured young adults to have access to the medical system and to use medical services. Among insured young adults, approximately equal percentages of those within each racial and ethnic group had a usual source of medical care. However, among those with private insurance, Hispanic young adults were less likely than non-Hispanic white and black young adults to have had a doctor visit in the past year.
Within each racial and ethnic group, uninsured young adults were about three times as likely as those with private insurance to have had unmet medical need. However, the level of unmet need varied; uninsured non-Hispanic white (37%) and non-Hispanic black (33%) young adults were more likely to have had unmet medical need than uninsured Hispanic (21%) young adults.
This report shows that among young adults aged 20–29 years, there are racial and ethnic disparities in health insurance coverage, in the receipt of health care services, and in the level of unmet need. The disparities in the receipt of health care services were mitigated to some extent by having health insurance coverage.
Definitions
Terms related to health insurance
Health insurance coverage: Health insurance is broadly defined to include both public and private payors who cover medical expenditures incurred by a defined population in a variety of settings. This includes persons covered by private health insurance, whether offered through employment or purchased individually, and persons covered by public programs such as Medicare, Medicaid, State Children’s Health Insurance Program (CHIP), and other state-sponsored programs. Persons with only Indian Health Service coverage or having only a private plan that paid for one type of service, such as accidents or dental care, were not considered to be covered by health insurance. In this report, coverage is measured at one point in time, which is the day of the National Health Interview Survey (NHIS) interview.
Private insurance: Private insurance is indicated when respondents report that they were covered by private health insurance through an employer, union, or individual purchase. Private health insurance includes managed care such as health maintenance organizations (HMOs). It does not include military health plans.
Medicaid: Medicaid is indicated when respondents report that they were covered by Medicaid. Individuals were also considered covered by Medicaid if they reported coverage by CHIP, or other state-sponsored plans. In this analysis, health insurance categories are hierarchical, and adults covered by both private insurance and Medicaid were considered to have private insurance.
Uninsured: Uninsured status is indicated when respondents report that they did not have coverage under private health insurance, Medicare, Medicaid, CHIP, another state-sponsored health plan, other government-sponsored programs, or a military health plan (TRICARE, VA, or CHAMP-VA). A person was also defined as uninsured if he or she had only Indian Health Service coverage or had only a private plan that paid for one type of service such as accidents or dental care.
Terms related to health care access and utilization
Doctor or other health professional: Doctor refers to medical doctors (MDs) and osteopathic physicians (DOs), including general practitioners and all types of specialists (such as internists, gynecologists, obstetricians, psychiatrists, and ophthalmologists). Other health care professional includes physician assistants, psychologists, nurses, physical therapists, chiropractors, etc.
Doctor or other health care professional contact: This may include a contact while a person is in the hospital as well as a contact from a home visit, but not a contact made to arrange appointments.
Emergency room visit: This includes all emergency room visits, even those that resulted in a hospital admission.
Unmet need: A person was considered to have unmet need if he or she did not get or delayed medical care due to cost in the past year.
Usual source of care: Usual source of care was measured by asking the respondent “Is there a place that you USUALLY go when you are sick or need advice about your health?” Persons who report the emergency department as their usual source of care are defined as having no usual source of care in this report.
Caveat
Most access and utilization measures in this report are based on the 12 months prior to interview, with the exception of a usual source of care. Usual source of care is based on a person’s status at the time of interview. Insurance coverage is also based on a person’s status at the time of interview. Therefore, an individual’s insurance status may have been different at the time health services were sought or received.
Data source and methods
Data from the 2008 and 2009 NHIS were used for this analysis. NHIS data are collected continuously throughout the year for the Centers for Disease Control and Prevention’s National Center for Health Statistics (NCHS), by interviewers from the U.S. Census Bureau. The NHIS collects information about the health and health care of the civilian, noninstitutionalized U.S. population. Interviews are conducted in respondents’ homes, but follow-ups to complete interviews may be conducted over the telephone. The family component collects information on all family members and the sample adult component collects additional data on a randomly selected adult (the “sample adult”). Questions about health insurance coverage and not getting medical care due to cost are asked of family respondents in the family component of the survey. Other questions on access and utilization are from the sample adult component. In 2008 and 2009, information was collected on a total of 21,218 persons aged 20–29 years from the family core component and 8,205 persons aged 20–29 years from the sample adult component of the survey. For further information about the NHIS including the questionnaire, see the NHIS website.
NHIS is designed to yield a sample representative of the civilian noninstitutionalized population of the United States, and this analysis uses weights to produce national estimates. Data weighting procedures are described in more detail elsewhere (6). Point estimates and estimates of corresponding variances for this analysis were calculated using SUDAAN software (7) to account for the complex sample design of the NHIS. The Taylor series linearization method was chosen for variance estimation. All estimates shown in this report meet the NCHS standard of reliability (relative standard error less than or equal to 30%). Differences between percentages were evaluated using two-sided significance tests at the 0.05 level. Terms such as “higher than” and “less than” indicate statistically significant differences. Terms such as “similar” and “no difference” indicate that the statistics being compared were not significantly different. Lack of comment regarding the difference between any two statistics does not necessarily suggest that the difference was tested and found to be not significant.
About the authors
Barbara Bloom and Robin A. Cohen are with the Centers for Disease Control and Prevention’s National Center for Health Statistics, Division of Health Interview Statistics.
References
- Agency for Health Care Research and Quality. National Health Disparities Report 2009. AHRQ Publication No. 10–0004. Rockville, MD: Agency for Health Care Research and Quality 2010.
- Kriss JL, Collins SR, Mahato B, Gould E, Schoen C. Rite of passage? Why young adults become uninsured and how new policies can help, 2008 update. The Commonwealth Fund. Issue Brief. 2008.
- Collins SR. Rising numbers of uninsured young adults: Causes, consequences, and new policies. Invited Testimony. Subcommittee on Federal Workforce, Postal Service, and the District of Columbia Committee on Oversight and Government Reform United States House of Representatives Hearing on “Providing Health Insurance to Young Adults Enrolled as Dependents in FEHBP.” 2008.
- National Center for Health Statistics. Health, United States, 2008: With Special Feature on the Health of Young Adults. Hyattsville, MD. 2009.
- Cohen RA, Bloom B. Access to and utilization of medical care for young adults aged 20–29 years: United States, 2008. NCHS data brief, no 29. Hyattsville, MD: National Center for Health Statistics. 2010.
- Botman SL, Moore TF, Moriarity CL, Parsons VL. Design and estimation for the National Health Interview Survey, 1995–2004. National Center for Health Statistics. Vital Health Stat 2(130). 2000.
- Research Triangle Institute. SUDAAN (Release 9.1). Research Triangle Park, NC: Research Triangle Institute. 2004.
Suggested citation
Bloom B, Cohen RA. Young adults seeking medical care: Do race and ethnicity matter? NCHS data brief, no 55. Hyattsville, MD: National Center for Health Statistics. 2011.
Copyright information
All material appearing in this report is in the public domain and may be reproduced or copied without permission; citation as to source, however, is appreciated.
National Center for Health Statistics
Edward J. Sondik, Ph.D., Director
Jennifer H. Madans, Ph.D., Associate Director for Science
Division of Health Interview Statistics
Jane F. Gentleman, Ph.D., Director
- Page last reviewed: November 6, 2015
- Page last updated: January 7, 2011
- Content source:


 ShareCompartir
