

Emergency Department Visitors and Visits: Who Used the Emergency Room in 2007?
 ShareCompartir
On This Page
- Key findings
- Emergency room use varies by race/ethnicity, age, and family income.
- ED use is associated with insurance status, with Medicaid beneficiaries being the most likely to have had an ED visit.
- Frequency of ED use was associated with insurance status, with Medicaid beneficiaries being the most likely to have visited the ED multiple times in the past year.
- Health insurance status was not associated with ED visits being triaged as nonurgent.
- Adults reporting fair or poor health status were the most likely to have used the ED.
- Persons with a usual source of medical care were no less likely to have had at least one ED visit than those without a usual source of care.
- Summary
- Definitions
- Data sources and methods
- About the authors
- References
- Suggested citation
NCHS Data Brief No. 38, May 2010
PDF Version (555 KB)
Tamyra Carroll Garcia, Amy B. Bernstein, and Mary Ann Bush
Key findings
- Older adults (aged 75 and over), non-Hispanic black persons, poor persons, and persons with Medicaid coverage were more likely to have had at least one emergency department (ED) visit in a 12-month period than those in other age, race, income, and insurance groups.
- Among the under-65 population, the uninsured were no more likely than the insured to have had at least one ED visit in a 12-month period.
- Persons with Medicaid coverage were more likely to have had multiple visits to the ED in a 12-month period than those with private insurance and the uninsured.
- ED visits by the uninsured were no more likely to be triaged as nonurgent than visits by those with private insurance or Medicaid coverage.
- Persons with and without a usual source of medical care were equally likely to have had one or more ED visits in a 12-month period.
Since 1996, demand for emergency services in the United States has been rising (1). While the number of emergency departments (EDs) across the country has decreased, the number of ED visits has increased (1). As a result, EDs are experiencing higher patient volume and overcrowding, and patients seeking care are experiencing longer wait times (2,3). As national health care costs continue to rise and policymakers become increasingly interested in ways to make the health care system more efficient, it is important to understand the characteristics of those individuals who use EDs–often in place of other sources of ambulatory care.
Keywords: uninsured, National Health Interview Survey, National Hospital Ambulatory Medical Care Survey, access to medical care
Emergency room use varies by race/ethnicity, age, and family income.
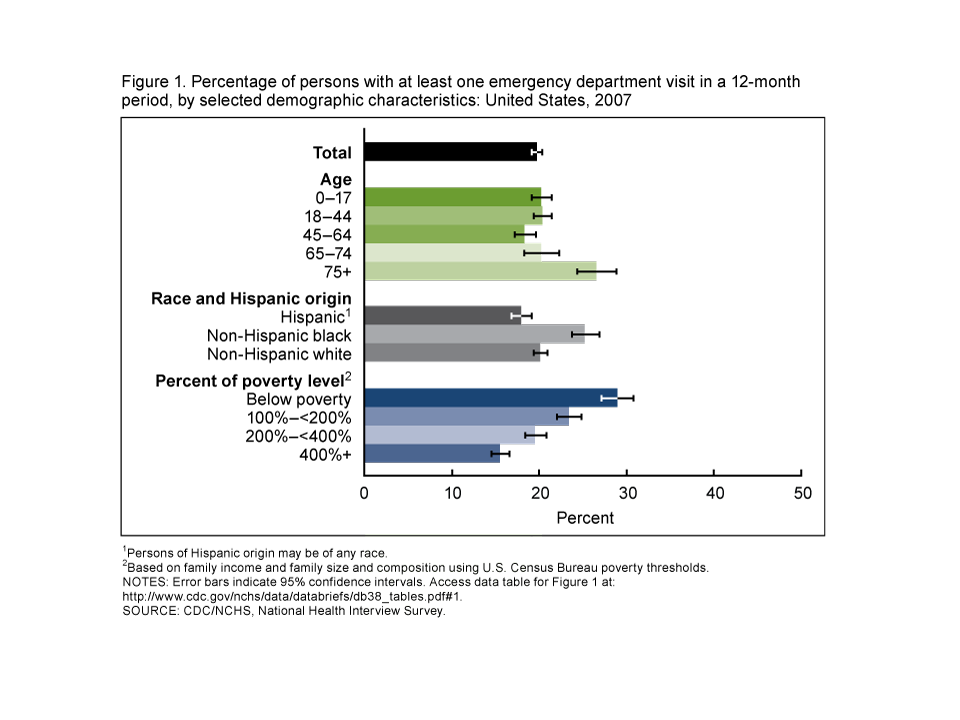
1Persons of Hispanic origin may be of any race.
2Based on family income and family size and composition using U.S. Census Bureau poverty thresholds.
NOTES: Error bars indicate 95% confidence intervals. Access data table for Figure 1 [PDF – 236 KB]
SOURCE: CDC/NCHS, National Health Interview Survey.
- In 2007, approximately one in five persons in the U.S. population had one or more ED visits in a 12-month period (Figure 1).
- Older adults–those aged 75 and over–were more likely to have had at least one ED visit in a 12-month period than people in younger age groups.
- Non-Hispanic black persons were more likely to have had one or more ED visits in a 12-month period than non-Hispanic white or Hispanic persons.
- As family income increased, the likelihood of having one or more ED visits in the past year decreased. These income-related differences were more pronounced than those based on age or race/ethnicity.
ED use is associated with insurance status, with Medicaid beneficiaries being the most likely to have had an ED visit.
- Among Medicaid beneficiaries under age 65, more than one-quarter of children and nearly two in five adults had one or more ED visits in a 12-month period (Figure 2). Medicaid beneficiaries were more likely to have had at least one ED visit in a 12-month period than persons with private insurance and the uninsured.
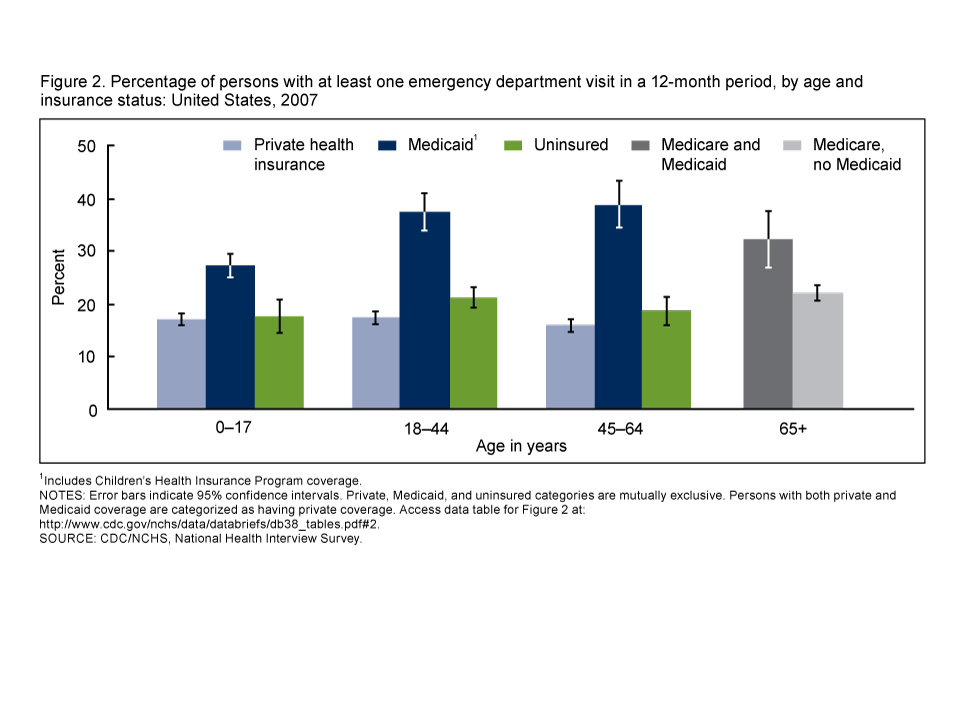
1Includes Children’s Health Insurance Program coverage.
NOTES: Error bars indicate 95% confidence intervals. Private, Medicaid, and uninsured categories are mutually exclusive. Persons with both private and Medicaid coverage are categorized as having private coverage. Access data table for Figure 2 [PDF – 236 KB]
SOURCE: CDC/NCHS, National Health Interview Survey.
- Among Medicare beneficiaries aged 65 and over, dually eligible persons with Medicaid were more likely than those without Medicaid to have had one or more visits to the ED in a 12-month period.
- Among children and among adults aged 45-64, the uninsured were no more likely than those with private insurance to have had at least one ED visit in a 12-month period.
- Among adults aged 18-44, by contrast, the uninsured were more likely than those with private insurance to have had at least one ED visit.
Frequency of ED use was associated with insurance status, with Medicaid beneficiaries being the most likely to have visited the ED multiple times in the past year.
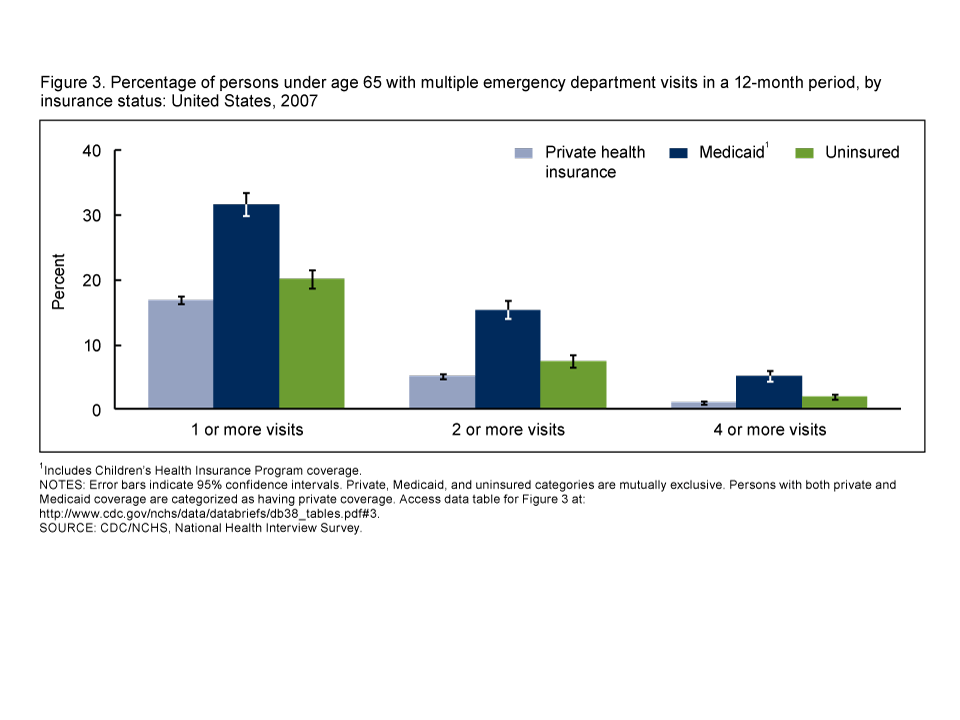
1Includes Children’s Health Insurance Program coverage.
NOTES: Error bars indicate 95% confidence intervals. Private, Medicaid, and uninsured categories are mutually exclusive. Persons with both private and Medicaid coverage are categorized as having private coverage. Access data table for Figure 3 [PDF – 236 KB]
SOURCE: CDC/NCHS, National Health Interview Survey.
- Approximately 15% of Medicaid beneficiaries under age 65 had two or more ED visits in a 12-month period, compared with 7% of the uninsured and 5% of the privately insured (Figure 3).
- The percentage of Medicaid beneficiaries under age 65 with four or more ED visits in a 12-month period (5%) was higher than the percentage of persons with four or more visits among the uninsured (2%) and those with private insurance (1%).
- The uninsured were more likely to have had multiple ED visits in the past year than those with private insurance.
Health insurance status was not associated with ED visits being triaged as nonurgent.
- In 2007, 10% of ED visits by persons under age 65 were considered nonurgent.
- ED visits were triaged as nonurgent at similar rates among the uninsured, persons with Medicaid coverage, and those with private insurance (Figure 4).
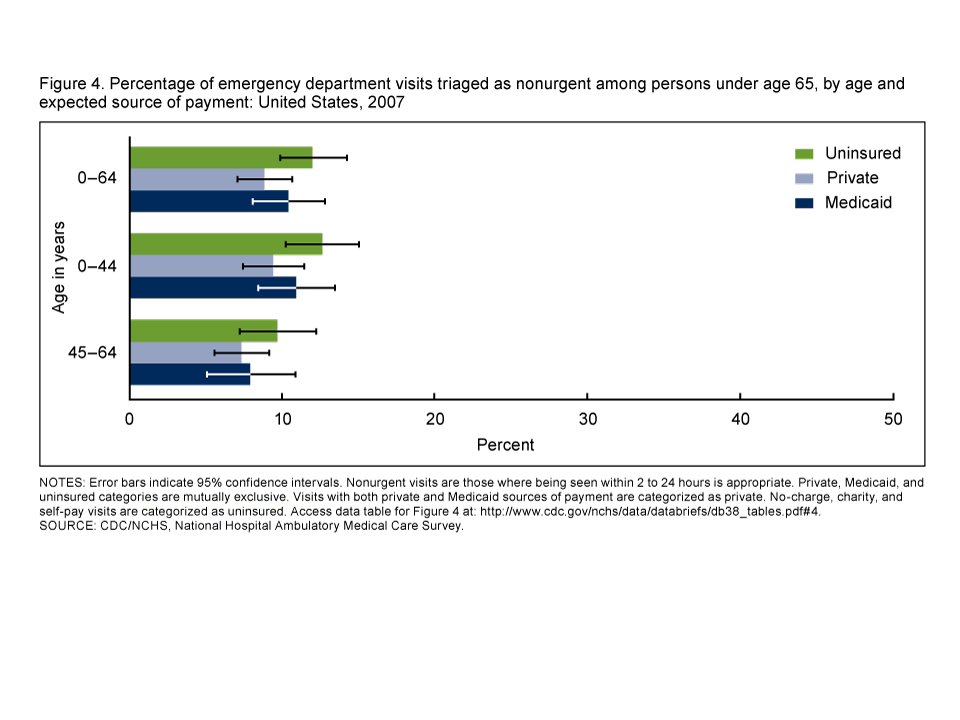
NOTES: Error bars indicate 95% confidence intervals. Nonurgent visits are those where being seen within 2 to 24 hours is appropriate. Private, Medicaid, and uninsured categories are mutually exclusive. Visits with both private and Medicaid sources of payment are categorized as private. No-charge, charity, and self-pay visits are categorized as uninsured. Access data table for Figure 4 [PDF – 236 KB]
SOURCE: CDC/NCHS, National Hospital Ambulatory Medical Care Survey.
Adults reporting fair or poor health status were the most likely to have used the ED.
- More than one-third of adults aged 18 and over with respondent-assessed fair or poor health status had at least one ED visit during the past 12 months, which was more than twice the rate for adults reporting very good or excellent health (Figure 5).
- Within each health status group, the percentage of adults who had at least one ED visit varied little across age groups.
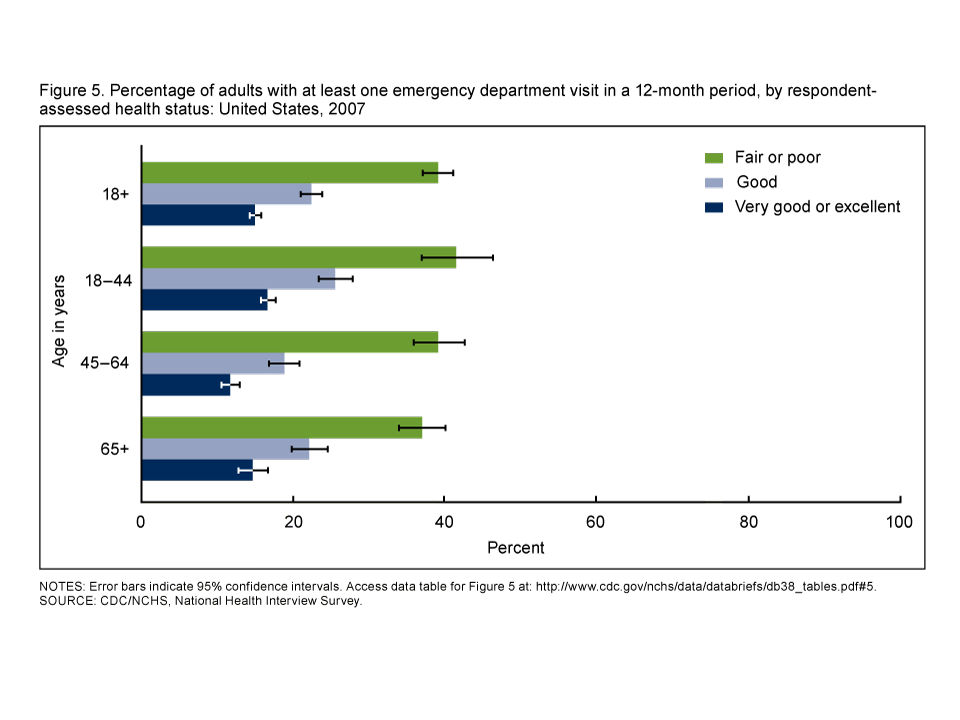
NOTES: Error bars indicate 95% confidence intervals. Access data table for Figure 5 [PDF – 236 KB]
SOURCE: CDC/NCHS, National Health Interview Survey.
Persons with a usual source of medical care were no less likely to have had at least one ED visit than those without a usual source of care.
- Children and adults under age 65 with and without a usual source of medical care were equally likely to have had at least one ED visit (Figure 6).
- Adults aged 65 and over with a usual source of medical care were more likely to have had an ED visit within a 12-month period than those without a usual source of care.
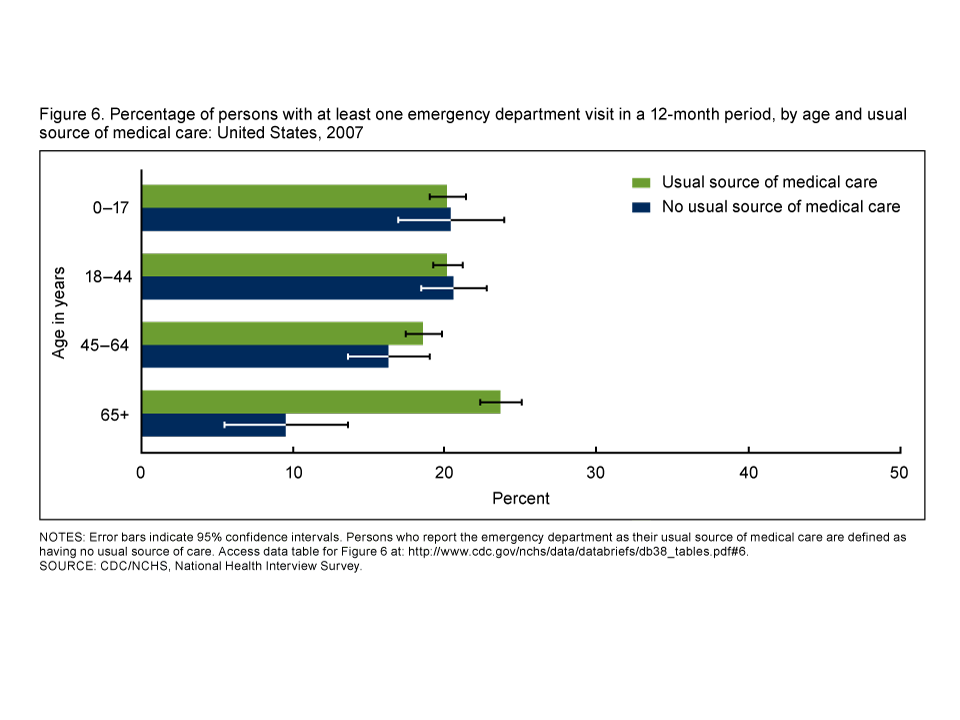
1NOTES: Error bars indicate 95% confidence intervals. Persons who report the emergency department as their usual source of medical care are defined as having no usual source of care. Access data table for Figure 6 [PDF – 236 KB]
SOURCE: CDC/NCHS, National Health Interview Survey.
Summary
EDs provide a critical service to persons in need of immediate, often life-saving, treatment and are a major component of the health care system. One fifth of the civilian noninstitutionalized population had at least one ED visit in 2007. The percentage of persons with at least one ED visit varied according to sociodemographic characteristics and respondent-assessed health status.
Persons with Medicaid coverage were more likely to report at least one ED visit and multiple ED visits in a 12-month period than those with private coverage or the uninsured. This finding may reflect higher rates of disability and chronic conditions among persons with public insurance, including Medicaid, relative to the uninsured (3). However, uninsured persons under age 65 were more likely to have multiple ED visits in a 12-month period than those with private insurance. The data also show that persons without a usual source of medical care are not more likely to have an ED visit than those with a usual source of care, and that uninsured persons are not more likely than others to access the ED for nonurgent visits. Future work should focus on untangling the complex interactions among the sociodemographic, health status, and health care access factors that appear to be associated with visits to the ED.
Definitions
ED visit: In the National Health Interview Survey (NHIS), respondents were asked the number of times they had gone to a hospital emergency room during the past 12 months, including visits that resulted in hospitalization, using the following response categories: none, 1, 2-3, 4-5, 6-7, 8-9, 10-12, 13-15, and 16 or more. In the National Hospital Ambulatory Medical Care Survey (NHAMCS), hospital ED visits are sampled, and trained survey staff abstract information on each ED visit.
Percent of poverty level: Reported and imputed family income was grouped into four categories based on family income as a percentage of the poverty level. Family income data were missing and imputed for 33% of all persons in NHIS in 2007. Poverty level is based on family income, family size, and number of children in the family, and, for families with two or fewer adults, the age of the adults in the family. For more information, visit the U.S. Census Bureau website.
Private health insurance: Indicated in NHIS when respondents reported that they were covered by any private health insurance–whether they purchased the policy on their own or coverage was purchased through an employer or union–at the time of their NHIS interview. Persons with both private insurance and Medicaid are categorized as having private insurance. In NHAMCS, private insurance was marked as the expected source of payment. When more than one expected source of payment was marked along with private, the visit was categorized as private.
Medicaid: Indicated in NHIS when respondents reported that they were covered by Medicaid, state-sponsored health plans, or the Children’s Health Insurance Program (CHIP) and did not report private insurance at the time of their NHIS interview. In NHAMCS, Medicaid/CHIP was marked as the expected source of payment.
Uninsured: Indicated in NHIS when respondents reported that they were not covered by private insurance, Medicaid, Medicare, CHIP, state-sponsored or other government-sponsored health plans, Medicare, or military health plans at the time of their NHIS interview. A person was also defined as uninsured if he or she had only Indian Health Service coverage or a private plan that paid for only one type of service, such as accidents or dental care. In NHAMCS, self-pay or no charge/charity was marked as the expected source of payment.
Medicare and Medicaid: Indicated in NHIS when respondents reported that they were covered by Medicare and Medicaid or state-sponsored health plans at the time of their NHIS interview. “Medicare, no Medicaid” is indicated in NHIS when respondents reported that they were covered by Medicare and did not report having Medicaid or state-sponsored health plans at the time of their NHIS interview. These respondents may have also reported additional types of coverage or no additional coverage.
Nonurgent visit: A visit in which the medical record indicates that patient should be seen within 120 minutes to 24 hours.
Respondent-assessed health status: Assessed in NHIS by asking the family respondent about his or her health or the health of a family member: “Would you say ___’s health is excellent, very good, good, fair, or poor?”
Usual source of medical care: Assessed in NHIS by asking the respondent: “Is there a place that you usually go when you are sick or need advice about your health?” Persons who reported the ED as their usual source of care were defined as having no usual source of care.
Data sources and methods
This report uses data from the 2007 NHIS and the 2007 NHAMCS.
National Health Interview Survey (NHIS) is a continuous, cross-sectional household interview survey drawn from all 50 states and the District of Columbia. The main objective of NHIS is to monitor the health of the U.S. population through the collection and analysis of data on a broad range of health topics. Data are collected through a personal household interview that contains Core questions plus Supplements. The Household and Family components of the Core questions include information on sociodemographic characteristics, health insurance, basic indicators of health status, and utilization of health care services. For this report, data on sociodemographic characteristics, health insurance, and respondent-reported health status are based on questions asked of family respondents in the Family component of NHIS, and data on ED visits and usual source of medical care are based on questions asked in the Sample Child and Sample Adult questionnaires. In the 2007 NHIS, the final Sample Child response rate was 76.5% and the final Sample Adult response rate was 67.8%. For further information about NHIS, including the questionnaire, visit the NHIS website.
National Hospital Ambulatory Medical Care Survey (NHAMCS) is designed to collect data on the utilization and provision of ambulatory care services in hospital EDs and outpatient departments. It is a national, representative sample of visits to the EDs and outpatient departments of nonfederal general or short-stay hospitals. Data are also collected on patients’ demographic characteristics, expected sources of payment, complaints, diagnostic or screening services, procedures, medication therapy, type of providers seen, reason for visit, and diagnoses. NHAMCS data on ED urgency in this analysis are restricted to ED visits by persons aged 0-64 where the urgency of the visit is known. Visits that were not triaged and visits where urgency was not reported are excluded. The percentage of visits that were excluded for these reasons did not differ significantly by insurance category, ranging from 15% for visits by persons with Medicaid to 17% for visits by the uninsured.
Point estimates and estimates of corresponding variances for this analysis were calculated using SUDAAN software (4) to account for the complex sample design of the surveys. All estimates shown have a relative standard error less than or equal to 30%. Differences between percentages were evaluated using two-sided significance tests at the 0.05 level. Terms such as “higher than” and “less than” indicate statistically significant differences. Terms such as “similar” and “no difference” indicate that the statistics being compared were not significantly different. Lack of comment regarding the difference between any two statistics does not necessarily mean that the difference was tested and found to be not significant.
About the authors
Tamyra Carroll Garcia, Amy B. Bernstein, and Mary Ann Bush are with the Centers for Disease Control and Prevention’s National Center for Health Statistics, Office of Analysis and Epidemiology.
References
- Pitts SR, Niska RW, Xu J, Burt CW. National Hospital Ambulatory Medical Care Survey: 2006 emergency department summary [PDF – 696 KB]. National health statistics reports; no 7. Hyattsville, MD: National Center for Health Statistics. 2008.
- Institute of Medicine. Hospital-based emergency care: At the breaking point. Washington, DC: National Academies Press. 2006.
- Newton MF, Keirns CC, Cunningham R, et al. Uninsured adults presenting to U.S. emergency departments: Assumptions vs data. JAMA 300(16):1914-24. 2008.
- SUDAAN, release 9.1 [computer software]. Research Triangle Park, NC: Research Triangle Institute. 2004.
Suggested citation
Garcia TC, Bernstein AB, Bush MA. Emergency department visitors and visits: Who used the emergency room in 2007? NCHS data brief, no 38. Hyattsville, MD: National Center for Health Statistics. 2010.
Copyright information
All material appearing in this report is in the public domain and may be reproduced or copied without permission; citation as to source, however, is appreciated.
National Center for Health Statistics
Edward J. Sondik, Ph.D., Director
Jennifer H. Madans, Ph.D., Associate Director for Science
Office of Analysis and Epidemiology
Linda T. Bilheimer, Ph.D., Director
- Page last reviewed: November 6, 2015
- Page last updated: May 19, 2010
- Content source: