

Births in the United States, 2016
 ShareCompartir
On This Page
- Key findings
- Birth rates for women under age 30 declined in 2016, whereas rates for women 30 and over rose.
- The cesarean delivery rate dropped below 32% in 2016.
- The preterm birth rate rose for the second straight year in 2016.
- Triplet and higher-order multiple births continued to decline in 2016.
- Summary
- Definitions
- Data source and methods
- About the authors
- References
- Suggested citation
NCHS Data Brief No. 287, September 2017
PDF Version (746 KB)
Joyce A. Martin, M.P.H, Brady E. Hamilton, Ph.D., and Michelle J.K. Osterman, M.H.S.
Key findings
Data from the National Vital Statistics System
- The U.S. general fertility rate declined to 62.0 births per 1,000 women aged 15–44 in 2016, down 1% from 2015.
- Birth rates declined among women under age 30 in 2016, and rose for women aged 30–44.
- The cesarean delivery rate continued to decline in 2016, down to 31.9% of all births.
- The preterm birth rate rose for the second straight year to 9.85% in 2016.
- The 2016 rate of triplet and higher-order multiple births was 48% lower than the 1998 peak.
This report presents several key demographic and maternal and infant health indicators using 2016 final birth data. Trends in the general fertility rate (the number of births per 1,000 women aged 15–44), age-specific birth rates, cesarean delivery, preterm, and triplet and higher-order multiple birth rates are presented by age of mother. For each indicator, data for 2016 are compared with 2015, and also with a year representing a recent high or low rate.
Keywords: fertility rates, preterm births, triplets, National Vital Statistics System
Birth rates for women under age 30 declined in 2016, whereas rates for women 30 and over rose.
- The general fertility rate declined 1% in 2016, to 62.0 births per 1,000 women aged 15–44. The rate is down 11% since 2007, the most recent high (Figure 1).
- The birth rate for teens aged 15–19 declined 9% from 2015 to 2016, to 20.3 births per 1,000 women. The rate has declined 51% since 2007.
- Birth rates for women in their twenties declined from 2015 to 2016, down 4% for women aged 20–24 (to 73.8 per 1,000 births) and 2% for women aged 25–29 (to 102.1).
- Birth rates for women in their thirties and early forties rose from 2015 to 2016, up 1% for women aged 30–34 (to 102.7), 2% for women aged 35–39 (to 52.7), and 4% for women aged 40–44 (to 11.4). Since 2007, the rate has risen 19% for women in their early forties, 2% for women in their early thirties, and 11% for women in their late thirties.
Figure 1. General fertility and age-specific birth rates, by age of mother: United States, 2007–2016
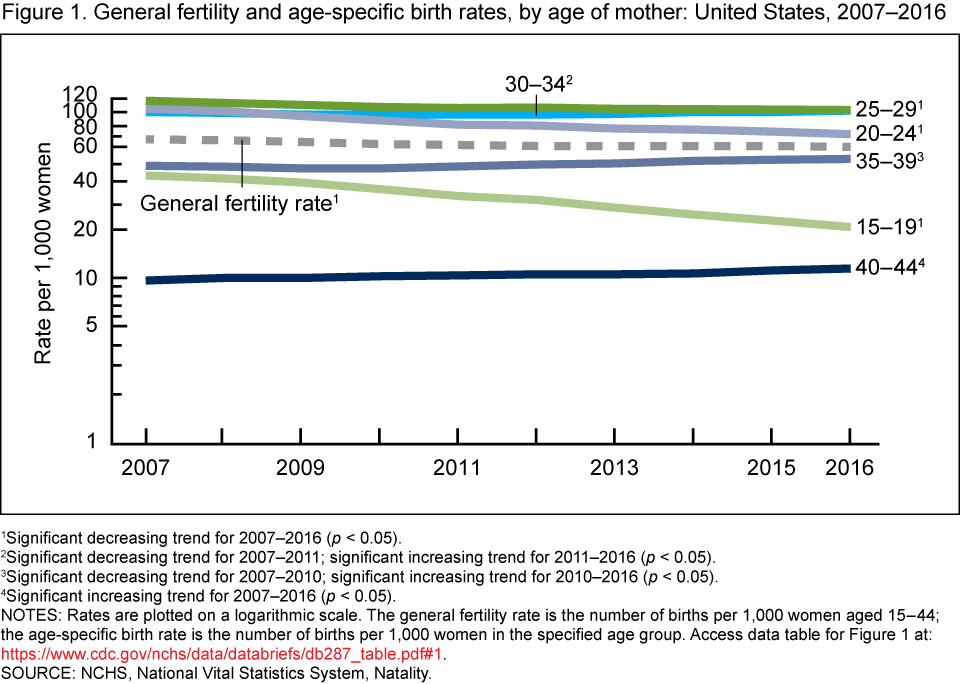
1Significant decreasing trend for 2007–2016 (p < 0.05).
2Significant decreasing trend for 2007–2011; significant increasing trend for 2011–2016 (p < 0.05).
3Significant decreasing trend for 2007–2010; significant increasing trend for 2010–2016 (p < 0.05).
4Significant increasing trend for 2007–2016 (p < 0.05).
NOTES: Rates are plotted on a logarithmic scale. The general fertility rate is the number of births per 1,000 women aged 15–44; the age-specific birth rate is the number of births per 1,000 women in the specified age group. Access data table for Figure 1.
SOURCE: NCHS, National Vital Statistics System, Natality.
The cesarean delivery rate dropped below 32% in 2016.
- The cesarean delivery rate declined to 31.9% in 2016, from 32.0% in 2015. The rate is down 3% from the peak of 32.9% in 2009 (Figure 2).
- Cesarean delivery rates decreased slightly (about 1%) from 2015 to 2016 for all maternal age groups.
- In 2016, rates were down 13.0% for mothers aged 20 and under (to 20.2), 6% for those aged 20–29 (28.5%), 5% for those aged 30–39 (36.3%), and 3% for women aged 40 and over (47.9%) from the 2009 peaks.
Figure 2. Cesarean delivery rates, by age of mother: United States, 2009, 2015, and 2016
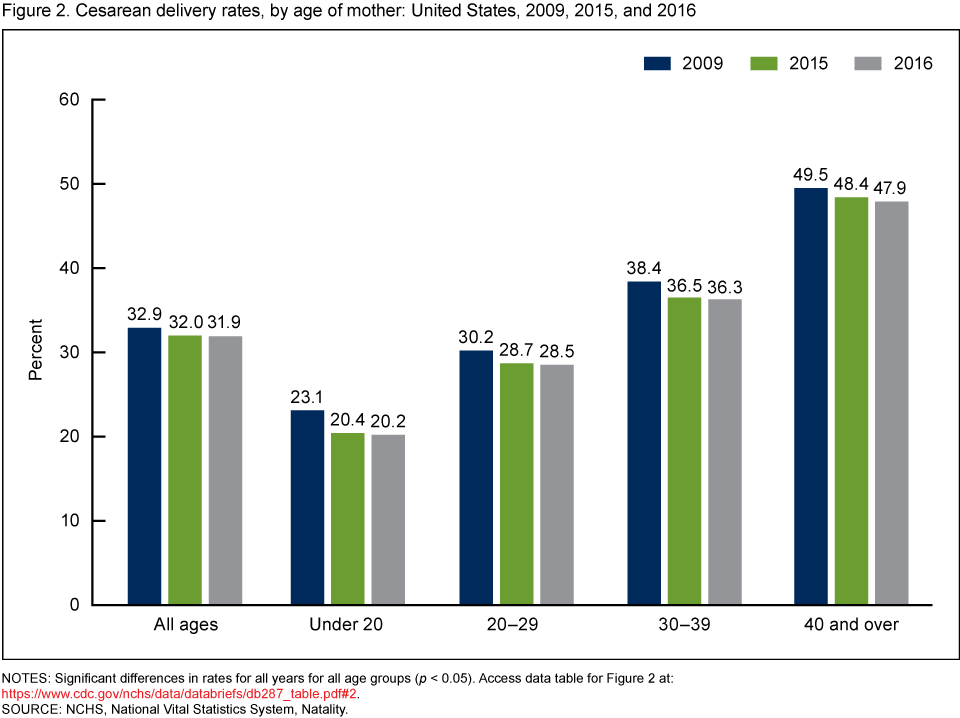
NOTES: Significant differences in rates for all years for all age groups (p < 0.05). Access data table for Figure 2.
SOURCE: NCHS, National Vital Statistics System, Natality.
The preterm birth rate rose for the second straight year in 2016.
- The preterm birth rate rose 2% in 2016 to 9.85%, from 9.63% in 2015, continuing the increase observed from 2014 (9.57% and a recent low) to 2015 (Figure 3).
- Most of the increase from 2014 to 2016 was among infants born late preterm, up 4% from 2014 to 2016 (6.82% to 7.09%). The early preterm birth rate was essentially unchanged (2.76% in 2016).
- Increases in late preterm birth rates occurred among all age groups from 2015 to 2016 and from 2014 to 2016. For 2014–2016, late preterm rates rose 5% for births to women under age 20, 4% for births to women in their twenties, 3% for births to women in their thirties, and 6% for births to women aged 40 and over.
Figure 3. Preterm birth rates, by age of mother: United States, 2014–2016
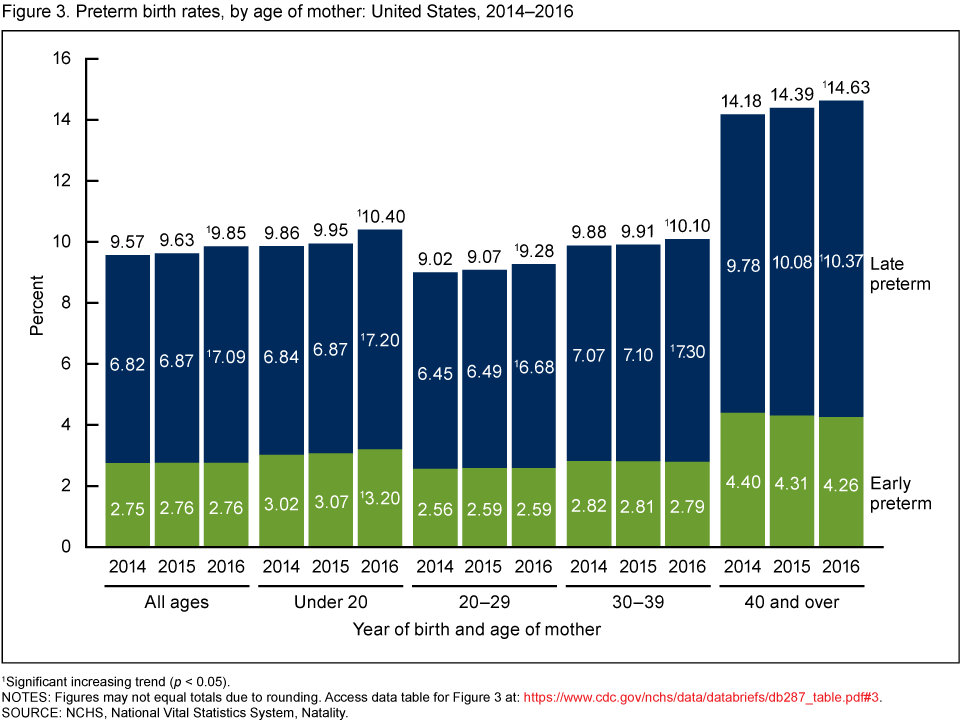
1Significant increasing trend (p < 0.05).
NOTES: Figures may not equal totals due to rounding. Access data table for Figure 3.
SOURCE: NCHS, National Vital Statistics System, Natality.
Triplet and higher-order multiple births continued to decline in 2016.
- The 2016 rate of triplet and higher-order multiple births was 101.4 per 100,000 total births, a non-statistically significant decline from 2015 (103.6). The 2016 rate declined 48%, to nearly one-half of the 1998 peak, 193.5 per 100,000 (Figure 4).
- Declines in triplet and higher-order multiple birth rates were seen for each group aged 20 and over from 1998–2016, with the largest declines among women aged 30–39 (down 64%) and women aged 40 and over (down 55%).
- For 2015–2016, the rate declined significantly for women aged 30–39 (from 146.4 to 135.3 per 100,000); changes for other age groups were not statistically significant.
Figure 4. Triplet and higher-order multiple birth rates, by age of mother: United States, 1998, 2015, and 2016
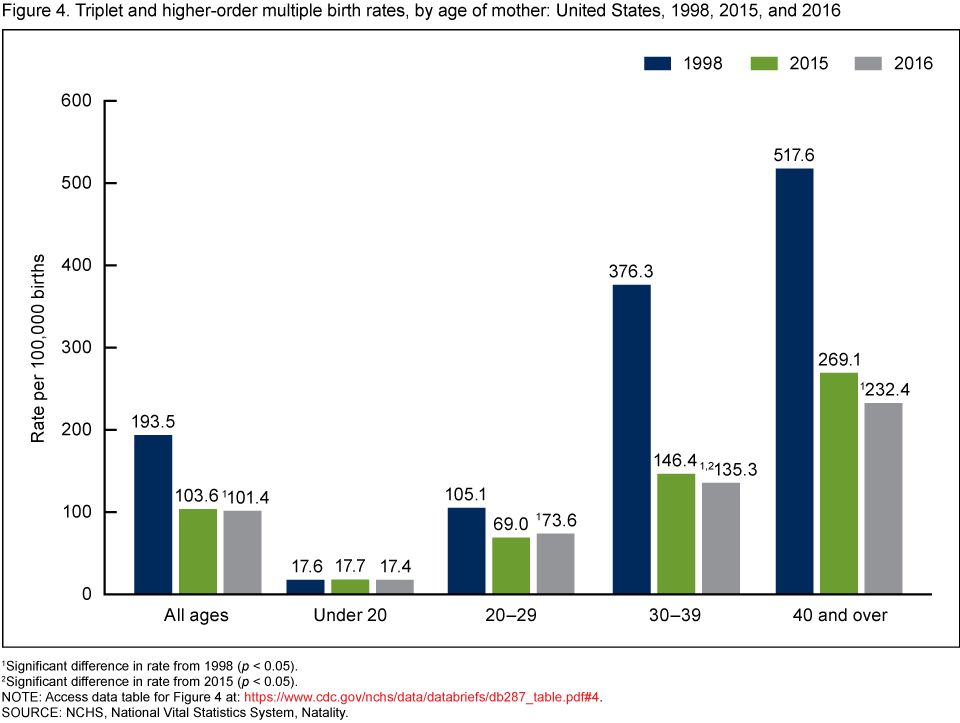
1Significant difference in rate from 1998 (p < 0.05).
2Significant difference in rate from 2015 (p < 0.05).
NOTE: Access data table for Figure 4.
SOURCE: NCHS, National Vital Statistics System, Natality.
Summary
Birth certificate data for the United States in 2016 show a continuation of recent trends for several key natality measures. The general fertility rate continued to fall, with record lows in teen childbearing and for women in their twenties (1,2). In contrast, rates for older women continued to rise, resulting in a higher birth rate for women aged 30–34 than for women aged 25–29 for the first time since 1940 when these data became available (2). The cesarean delivery rate declined 3% from the record high in 2009 and was under 32% in 2016 for the first year in a decade (31.8% in 2007) (1). The rate for triplet and higher-order multiple births has been on the decline since 1998, the record highest year for this rate, and was the lowest in more than two decades (since 1992) (1). For both measures, declines were observed for most or all age groups. The rate of preterm birth had been on the decline in the United States (from 10.44% in 2007 to 9.57% in 2014) (1). Although the recent upturn in the preterm birth rate is of shorter duration (2014–2016) than the other measures presented in this report, it is of concern—infants born prior to full term (39–40 completed weeks of gestation) are at higher risk of morbidity and mortality than those born at a later gestational age (3). Provisional data indicate an extension of the upward trend in this rate through the first quarter of 2017 (4).
Definitions
General fertility rate: Number of births per 1,000 women aged 15–44.
Age-specific birth rate: Number of births per 1,000 women in the specified age group.
Cesarean delivery rate: Number of births delivered by cesarean per 100 births.
Preterm birth rate: Number of births delivered before 37 completed weeks of gestation per 100 births. Gestational age is based on the obstetric estimate of gestation (5).
Early preterm birth rate: Number of births delivered before 34 completed weeks of gestation per 100 births.
Late preterm birth rate: Number of births delivered at 34–36 completed weeks of gestation per 100 births.
Triplet/+ birth rate: Number of triplet and higher-order multiple births per 100,000 total births.
Data source and methods
This report is based on data from the Natality Data File from the National Vital Statistics System (NVSS). The vital statistics natality file is based on information derived from birth certificates and includes information for all births occurring in the United States. This data brief accompanies the release of the 2016 natality public-use file (6). A more detailed analysis of the topics presented in this report and many others, including births to unmarried women, prenatal care, tobacco use during pregnancy, source of payment for delivery, pregnancy risk factors, receipt of Women, Infants, and Children (WIC) food, maternal morbidity, and breastfeeding, is possible by using the annual natality files (6). Data are not presented separately in this report for women aged 15 and under or age 45 and over. For 2016 information on these age groups, see “Births: Provisional Data for 2016” (7).
References to increases or decreases in rates or percentages indicate that differences are statistically significant at the 0.05 level. Trends in rates for (Figure 1) were evaluated using the Joinpoint Regression Program. Trends in rates for (Figures 2–4) were assessed using the Cochran-Armitage test for trends, a modified Chi-squared test. Computations exclude records for which information is unknown.
About the authors
Joyce A. Martin, Brady E. Hamilton, and Michelle J.K. Osterman are with the National Center for Health Statistics, Division of Vital Statistics, Reproductive Statistics Branch.
References
- Martin JA, Hamilton BE, Osterman MJK, et al. Births: Final data for 2015. National vital statistics reports; vol 66 no 1. Hyattsville, MD: National Center for Health Statistics. 2017.
- National Center for Health Statistics. Vital statistics of the United States, 2003, Volume I, Natality. 2003.
- Born too Soon Executive Summary Group. Writers Kinney MV, Howson CP, McDougall L, Lawn JE. Executive Summary for Born too Soon: The global action report on preterm birth. March of Dimes, PMNCH, Save the Children, World Health Organization. 2012.
- Rossen LM, Osterman MJK, Hamilton BE, Martin JA. Quarterly provisional estimates for selected birth indicators, 2015–Quarter 1, 2017. National Center for Health Statistics. National Vital Statistics System, Vital Statistics Rapid Release Program. 2017.
- Martin JA, Osterman MJK, Kirmeyer SE, Gregory ECW. Measuring gestational age in vital statistics data: Transitioning to the obstetric estimate. National vital statistics reports; vol 64, no 5. Hyattsville, MD: National Center for Health Statistics. 2015.
- National Center for Health Statistics. Natality public-use file and CD-ROM. Hyattsville, MD: National Center for Health Statistics. Published annually.
- Hamilton BE, Martin JA, Osterman MJK, et al. Births: Provisional data for 2016. Vital statistics rapid release; no 2. Hyattsville, MD: National Center for Health Statistics. 2017.
Suggested citation
Martin JA, Hamilton BE, Osterman MJK. Births in the United States, 2016. NCHS data brief, no 287. Hyattsville, MD: National Center for Health Statistics. 2017.
Copyright information
All material appearing in this report is in the public domain and may be reproduced or copied without permission; citation as to source, however, is appreciated.
National Center for Health Statistics
Charles J. Rothwell, M.S., M.B.A., Director
Jennifer H. Madans, Ph.D., Associate Director for Science
Division of Vital Statistics
Delton Atkinson, M.P.H., M.P.H., P.M.P., Director
Hanyu Ni, Ph.D., M.P.H., Associate Director for Science
- Page last reviewed: September 26, 2017
- Page last updated: September 26, 2017
- Content source: