

Utilization of Clinical Preventive Services for Cancer and Heart Disease Among Insured Adults: United States, 2015
 ShareCompartir
On This Page
- Key findings
- More than 6 out of 10 insured adults aged 50–75 had been screened for colorectal cancer within the recommended intervals.
- More than 8 out of 10 insured women aged 21–65 had been screened for cervical cancer within the recommended intervals.
- Nearly three out of four insured women aged 50–74 had been screened for breast cancer in the past 2 years.
- More than 8 in 10 insured adults aged 18 and over had their blood pressure checked by a doctor, nurse, or other health professional in the past 12 months.
- About two out of three overweight and obese insured adults aged 40–70 had a fasting blood test for high blood sugar or diabetes in the past 12 months.
- Summary
- Definitions
- Data source and methods
- About the authors
- References
- Suggested citation
NCHS Data Brief No. 274, March 2017
PDF Version (355 KB)
Anjel Vahratian, Ph.D. and Stephen J. Blumberg, Ph.D.
Key findings
Data from the National Health Interview Survey
- Two-thirds of insured adults aged 50–75 were screened for colorectal cancer within the recommended intervals.
- Insured women aged 30–39 (90.5%) were more likely than their older peers to be screened for cervical cancer within the recommended intervals.
- Seventy-three percent of insured women aged 50–74 had a mammogram in the past 2 years.
- The percentage of insured adults who had a cardiovascular risk screening (blood pressure, blood sugar) within the recommended intervals significantly increased with advancing age for both men and women.
Recent improvements in health insurance coverage (1) have been associated with improved access to health care (2–4) and increased utilization of preventive services (5). Most insurance plans are now required to cover specific clinical preventive services without copayment from the insured adult (6). This report presents the proportion of insured adults who received selected services that are recommended for the prevention or early detection of cancer and heart disease. Sex- and age-specific differences are examined. The age groups included in each chart vary because the selected preventive services are recommended for different age groups.
Keywords: diabetes, hypertension, National Health Interview Survey
More than 6 out of 10 insured adults aged 50–75 had been screened for colorectal cancer within the recommended intervals.
- The percentage of insured adults who had any colorectal cancer screening test was significantly associated with age for both men and women (Figure 1).
- Insured women aged 50–59 (58.1%) were more likely to be screened for colorectal cancer compared with men of the same age (54.0%).
- Men and women aged 60 and over were similarly likely to be screened for colorectal cancer within the recommended intervals.
Figure 1. Percentage of insured adults aged 50–75 who had any colorectal cancer screening test within the recommended intervals, by sex and age group: United States, 2015
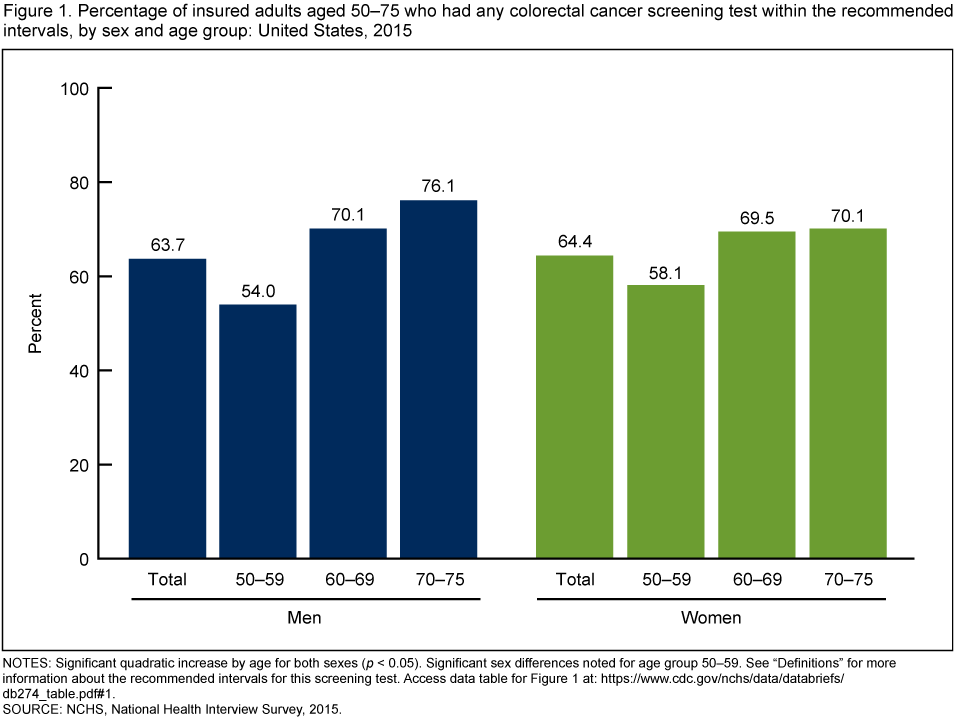
NOTES: Significant quadratic increase by age for both sexes (p < 0.05). Significant sex differences noted for age group 50–59. See “Definitions” for more information about the recommended intervals for this screening test. Access data table for Figure 1.
SOURCE: NCHS, National Health Interview Survey, 2015.
More than 8 out of 10 insured women aged 21–65 had been screened for cervical cancer within the recommended intervals.
- After age 30–39, receipt of screening within the recommended intervals declined (Figure 2).
- Insured women aged 21–29 and 60–65 had similar percentages of those screened for cervical cancer within the recommended intervals.
Figure 2. Percentage of insured women aged 21–65 who have not had a hysterectomy and had a cervical cancer screening test within the recommended intervals, by age group: United States, 2015
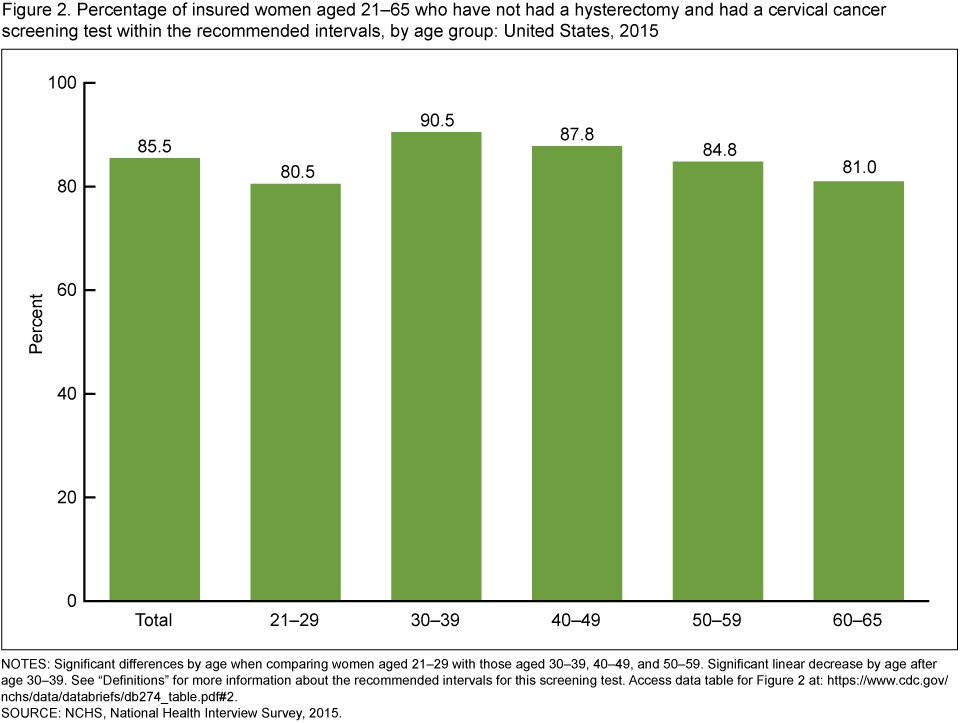
NOTES: Significant differences by age when comparing women aged 21–29 with those aged 30–39, 40–49, and 50–59. Significant linear decrease by age after age 30–39. See “Definitions” for more information about the recommended intervals for this screening test. Access data table for Figure 2.
SOURCE: NCHS, National Health Interview Survey, 2015.
Nearly three out of four insured women aged 50–74 had been screened for breast cancer in the past 2 years.
- The percentage of insured women who had a mammogram in the past 2 years to screen for breast cancer ranged from 72.1% for women aged 70–74 to 74.2% for women aged 60–69 (Figure 3).
- The percentage of insured women who had a mammogram in the past 2 years was similar across age groups.
Figure 3. Percentage of insured women aged 50–74 who had a mammogram in the past 2 years, by age group: United States, 2015
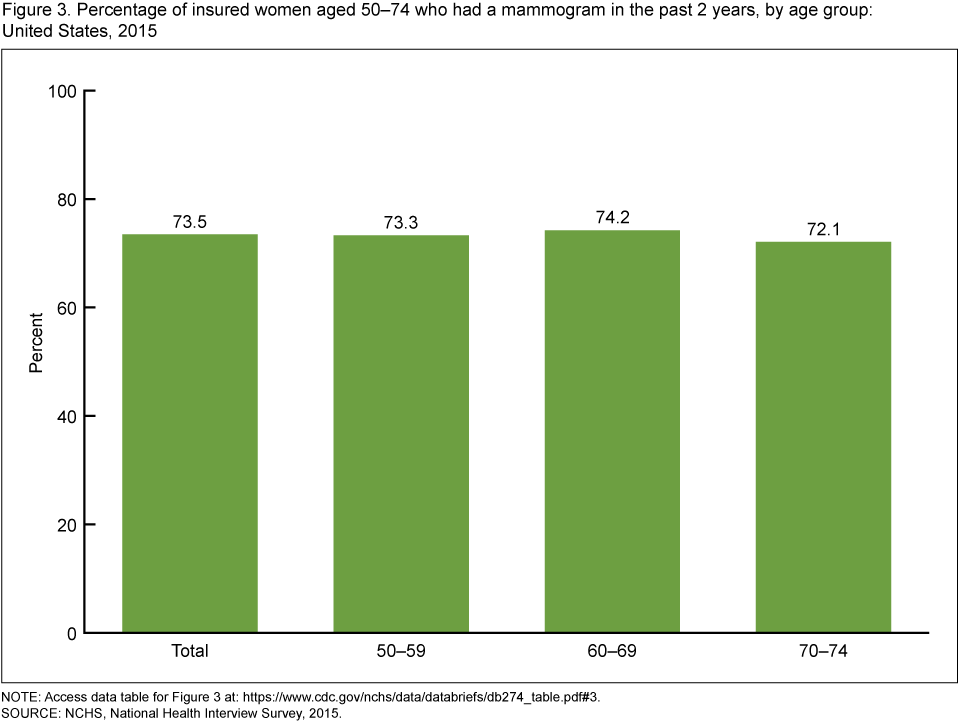
NOTE: Access data table for Figure 3.
SOURCE: NCHS, National Health Interview Survey, 2015.
More than 8 in 10 insured adults aged 18 and over had their blood pressure checked by a doctor, nurse, or other health professional in the past 12 months.
- The percentage of insured adults who had their blood pressure checked by a doctor, nurse, or other health professional in the past 12 months increased with advancing age (Figure 4).
- Insured women aged 18–39 (86.7%) and 40–64 (91.7%) were more likely than men in the same age groups (70.4% and 86.1%, respectively) to have their blood pressure checked by a doctor, nurse, or other health professional in the past 12 months.
- No significant differences by sex were observed among insured adults after age 64.
Figure 4. Percentage of insured adults aged 18 and over who had their blood pressure checked by a doctor, nurse, or other health professional in the past 12 months, by sex and age group: United States, 2015
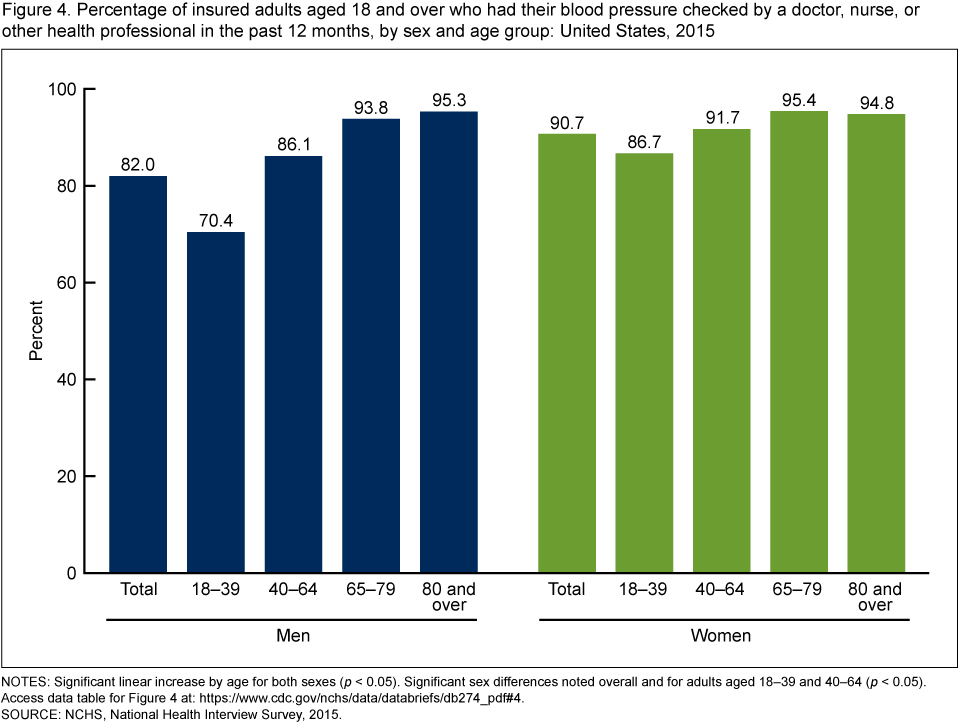
NOTES: Significant linear increase by age for both sexes (p < 0.05). Significant sex differences noted overall and for adults aged 18–39 and 40–64 (p < 0.05). Access data table for Figure 4.
SOURCE: NCHS, National Health Interview Survey, 2015.
About two out of three overweight and obese insured adults aged 40–70 had a fasting blood test for high blood sugar or diabetes in the past 12 months.
- The percentage of insured overweight and obese adults who had a fasting blood test for high blood sugar or diabetes in the past 12 months increased with advancing age (Figure 5).
- Insured women aged 40–49 (56.4%) were more likely than men in the same age group (49.5%) to have had a fasting blood test for high blood sugar or diabetes in the past 12 months.
- No significant differences by sex were observed among insured adults aged 50–70.
Figure 5. Percentage of overweight and obese insured adults aged 40–70 who had a fasting test for high blood sugar or diabetes during the past 12 months, by sex and age group: United States, 2015
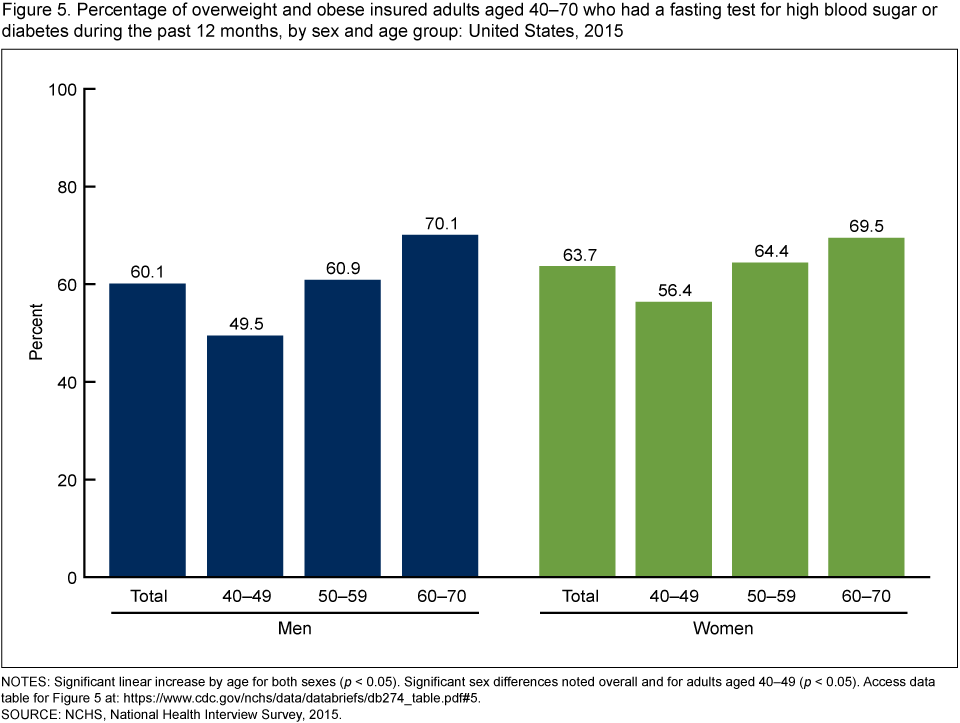
NOTES: Significant linear increase by age for both sexes (p < 0.05). Significant sex differences noted overall and for adults aged 40–49 (p < 0.05). Access data table for Figure 5.
SOURCE: NCHS, National Health Interview Survey, 2015.
Summary
Utilization of clinical preventive services aimed at the early detection of cancer and cardiovascular disease varied by sex and age among insured adults. In this analysis, insured adults in their 40s and 50s were less likely than those in their 60s to be screened for colorectal cancer, high blood pressure, and diabetes. Limited knowledge about the recommendations for clinical preventive services may prevent eligible adults from seeking timely preventive care (7,8).
Younger insured women were more likely than men of the same age to have had a colorectal cancer screening test within the recommended intervals and their blood pressure and blood sugar checked in the past 12 months. These sex-specific differences may be due, in part, to women’s increased and earlier utilization of health care for reproductive health services (9–11).
Lastly, insured women aged 40–65 were less likely to be screened for cervical cancer within the recommended intervals compared with those aged 30–39, while no significant differences were seen in breast cancer screening by age for those aged 50–74. The findings in this report highlight areas for further research and targeted health promotion.
Definitions
The recommended intervals for the clinical preventive services included in this report are drawn from the U.S. Preventive Services Task Force (USPSTF) guidelines (12). Most health insurance plans are required to cover specific clinical preventive services, including those that have received an A or B rating from the USPSTF, without requiring the insured person to pay a portion of the costs (6).
Blood pressure screening: Based on a positive response to the survey question, “During the past 12 months, have you had your blood pressure checked by a doctor, nurse, or other health professional?” The 2015 USPSTF recommends screening for high blood pressure or hypertension in adults aged 18 and over (12).
Breast cancer screening: Based on the 2009 USPSTF recommendation that women aged 50–74 have a mammogram every 2 years (12).
Cervical cancer screening: Based on the 2012 USPSTF recommendation that women aged 21–65 without a prior hysterectomy have a Pap smear every 3 years or for women aged 30–65 who want to lengthen the screening interval, screening with a combination of a Pap smear and human papillomavirus (HPV) testing every 5 years (12).
Colorectal cancer screening: Based on the 2008 USPSTF recommendation that adults aged 50–75 have either a colonoscopy within the past 10 years, a sigmoidoscopy within the past 5 years combined with a home blood stool test every 3 years, or a home blood stool or fecal immunochemical test within the past year (12).
Diabetes screening: Based on a positive response to the survey question, “Have you had a fasting test for high blood sugar or diabetes during the past 12 months?” The 2015 USPSTF recommends screening for high blood sugar or diabetes as part of a cardiovascular risk assessment in adults aged 40–70 who are overweight and obese (12).
Health insurance coverage: Insured adults included those who, at the time of interview, had any private health insurance, Medicare, Medicaid, Children’s Health Insurance Program, a state-sponsored or other government health plan, or a military plan.
Overweight and obesity: Based on cut points of body mass index (BMI). BMI was calculated as reported weight in kilograms divided by reported height in meters squared. Overweight and obesity in adults was defined as a BMI of equal to or greater than 25.
Data source and methods
Data from the 2015 National Health Interview Survey (NHIS) were used for this analysis. NHIS is a multipurpose health survey conducted continuously throughout the year by the National Center for Health Statistics. Interviews are conducted in person in respondents’ homes, but follow-ups to complete interviews may be conducted over the telephone. Data for this analysis came from the Family Core and Sample Adult components of NHIS. For further information about NHIS, including the questionnaire, visit the NHIS website.
All analyses used weights to produce national estimates. Estimates on clinical preventive services in this report are nationally representative of the civilian noninstitutionalized adult population living in households across the United States. The sample design is described in more detail elsewhere (13). Point estimates and their estimated variances were calculated using SUDAAN software (14) to account for the complex sample design of NHIS. Linear and quadratic trend tests of the estimated proportions across the age groups were tested in SUDAAN via PROC DESCRIPT using the POLY option. Differences between percentages were evaluated using two-sided significance tests at the 0.05 level.
About the authors
Anjel Vahratian and Stephen J. Blumberg are with the National Center for Health Statistics, Division of Health Interview Statistics.
References
- Cohen RA, Martinez ME, Zammitti EP. Health insurance coverage: Early release of estimates from the National Health Interview Survey, 2015. National Center for Health Statistics. May 2016.
- Martinez ME, Ward BW, Adams PF. Health care access and utilization among adults aged 18–64, by race and Hispanic origin: United States, 2013 and 2014. NCHS data brief, no 208. Hyattsville, MD: National Center for Health Statistics. 2015.
- Martinez ME, Ward BW. Health care access and utilization among adults aged 18–64, by poverty level: United States, 2013–2015. NCHS data brief, no 262. Hyattsville, MD: National Center for Health Statistics. 2016.
- Sommers BD, Blendon RJ, Orav EJ, Epstein AM. Changes in utilization and health among low-income adults after Medicaid expansion or expanded private insurance. JAMA Intern Med 176(10):1501–9. 2016.
- Han X, Yabroff KR, Robbins AS, Zheng Z, Jemal A. Dependent coverage and use of preventive care under the Affordable Care Act. N Engl J Med 371(24):2341–2. 2014.
- Koh HK, Sebelius KG. Promoting prevention through the Affordable Care Act. N Engl J Med 363(14):1296–9. 2010.
- Lantz PM, Evans WD, Mead H, Alvarez C, Stewart L. Knowledge of and attitudes toward evidence-based guidelines for and against clinical preventive services: Results from a national survey. Milbank Q 94(1):51–76. 2016.
- Koh HK, Rajkumar R, McDonough JE. Reframing prevention in the era of health reform. JAMA 316(10):1039–40. 2016.
- Vahratian A. QuickStats: Percentage of adults aged ≥ 18 who have seen or talked to a doctor or other health care professional about their own health in the past 12 months, by sex and age group—National Health Interview Survey, United States, 2015. MMWR Morb Mortal Wkly Rep 66(02):65. 2017.
- Martinez GM, Chandra A, Febo-Vazquez I, Mosher WD. Use of family planning and related medical services among women aged 15–44 in the United States: National Survey of Family Growth, 2006–2010. National health statistics reports; no 68. Hyattsville, MD: National Center for Health Statistics. 2013.
- Hing E, Albert M. State variation in preventive care visits, by patient characteristics, 2012. NCHS data brief, no 234. Hyattsville, MD: National Center for Health Statistics. 2016.
- U.S. Preventive Services Task Force. USPSTF A and B recommendations. 2017.
- Parsons VL, Moriarity C, Jonas K, et al. Design and estimation for the National Health Interview Survey, 2006–2015. National Center for Health Statistics. Vital Health Stat 2(165). 2014.
- RTI International. SUDAAN (Release 11.0.0) [computer software]. 2012.
Suggested citation
Vahratian A, Blumberg SJ. Utilization of clinical preventive services for cancer and heart disease among insured adults: United States, 2015. NCHS data brief, no 274. Hyattsville, MD: National Center for Health Statistics. 2017.
Copyright information
All material appearing in this report is in the public domain and may be reproduced or copied without permission; citation as to source, however, is appreciated.
National Center for Health Statistics
Charles J. Rothwell, M.S., M.B.A., Director
Jennifer H. Madans, Ph.D., Associate Director for Science
Division of Health Interview Statistics
Marcie L. Cynamon, Director
Stephen J. Blumberg, Ph.D., Associate Director for Science
- Page last reviewed: March 8, 2017
- Page last updated: March 8, 2017
- Content source: