

Who Marries and When? Age at First Marriage in the United States: 2002
 ShareCompartir
On This Page
- Key findings
- What are the marital experiences of women and men 25-44 years of age in the United States?
- What are the probabilities of first marriage by various ages for men and women?
- Are there sex and race and Hispanic origin differences in the probability of first marriage by various ages?
- Who has not married by age 35 and by age 40?
- Summary
- Definitions
- Data source and methods
- About the authors
- References
- Suggested Citation
NCHS Data Brief No. 19, June 2009
PDF Version (498 KB)
by Paula Goodwin, Ph.D.; Brittany McGill, M.P.P.; and Anjani Chandra, Ph.D.
Key findings
Data from the 2002 National Survey of Family Growth
- Over 70% of men and women aged 25-44 have ever been married: 71% of men and 79% of women.
- Non-Hispanic black men and women aged 25-44 have lower percentages who have ever been married than non-Hispanic white and Hispanic persons of the same age.
- The probability that men will marry by age 40 is 81%; for women, it is 86%.
- A larger percentage of women than men aged 35-44 have married by age 35.
- Smaller percentages of non-Hispanic black women aged 35-44 have married by age 35 than non-Hispanic white or Hispanic women of the same age range.
- Smaller percentages of non-Hispanic black men aged 35-44 who are below the poverty line have been married by age 35 than non-Hispanic black men of the same age who are at least 200% above poverty.
During the latter half of the 20th century, there were notable increases in the age at first marriage among Americans and related increases in the proportion of unmarried and never-married adults (1,2). Research finds that, in comparison with unmarried persons, married persons tend to exhibit greater physical, emotional, and economic wellbeing, although the association may vary by outcome, sex, and other factors (3–5). Children in households with two married parents differ from those in other types of households on measures such as child achievement, but the causal processes are complex (4,6,7). Given the potential benefits of marriage, concerns over a decline in marriage have prompted a great deal of attention as well as investment in marriage promotion programs, such as the Department of Health and Human Services’ Healthy Marriage Initiative (8). This report highlights what we know about the incidence and timing of first marriage among women and men 15-44 years of age in the United States, based on data from the National Survey of Family Growth (NSFG) conducted in 2002.
Keywords: age, marriage, National Survey of Family Growth
What are the marital experiences of women and men 25-44 years of age in the United States?
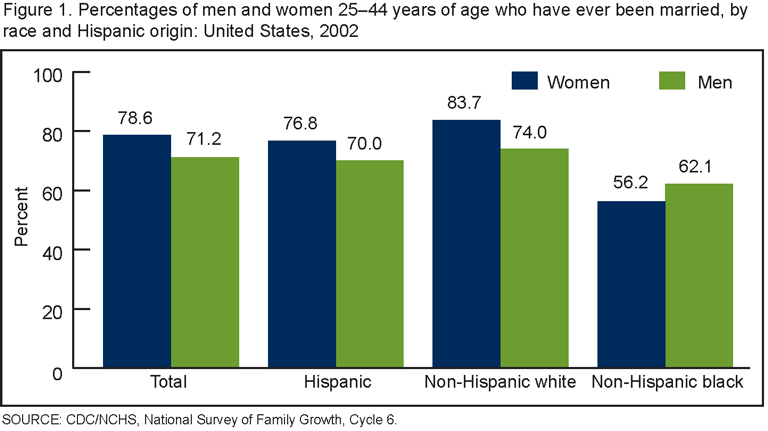
Over 70% of women and men 25-44 years of age have ever been married: 79% of women and 71% of men.
Lower percentages of non-Hispanic black men aged 25-44 years have ever been married compared with non-Hispanic white men of the same age range.
Among women 25-44 years of age, non-Hispanic white women have the highest percentage that have ever been married (84%) and non-Hispanic black women have the lowest percentage that have ever been married (56%).
What are the probabilities of first marriage by various ages for men and women?
Figures 2 and 3 are based on analyses using a life table methodology that calculates how likely it is that an individual will marry by each of the ages shown (see “Definitions”).
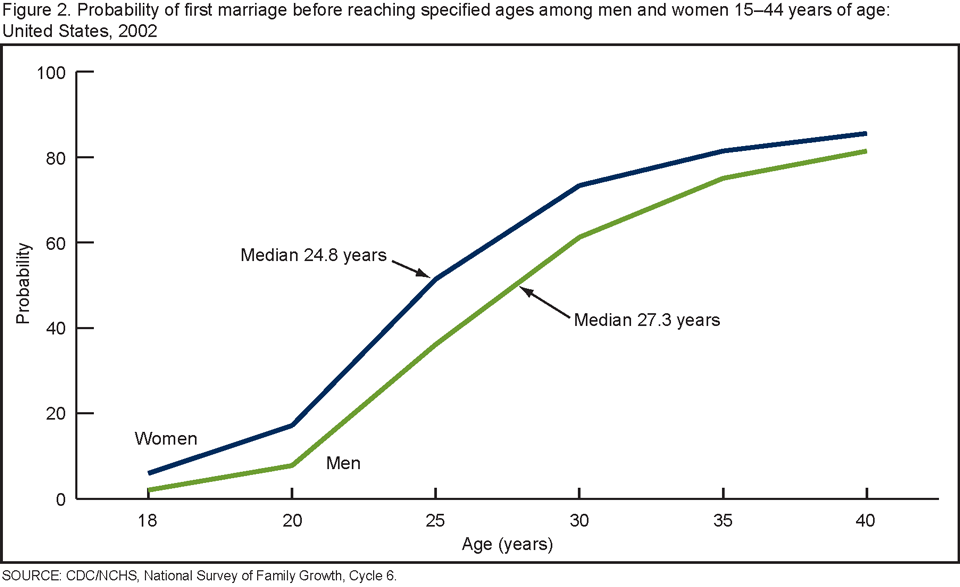
The probability of first marriage by age 18 is low for both men and women: 6% for women and 2% for men.
There is a 50% probability that women will have married for the first time by the age of 25. Not until age 27 is there a 50% probability that men will have married for the first time.
The probability of first marriage by age 30 is 74% for women and 61% for men.
The probability of first marriage by age 40 is 86% for women and 81% for men.
Women have higher probabilities than men of experiencing a first marriage by each age shown, except at age 40 (where the difference is not statistically significant).
Are there sex and race and Hispanic origin differences in the probability of first marriage by various ages?
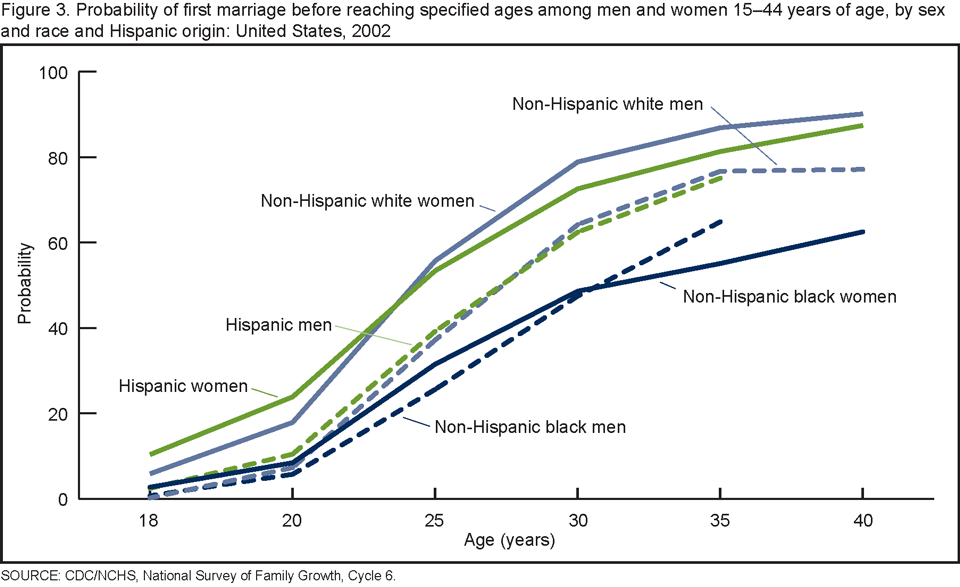
The probabilities that non-Hispanic white and Hispanic men and women will marry for the first time between the ages of 25 and 40 are higher than the probabilities for non-Hispanic black men and women.
Disparities in marital experience by race and Hispanic origin groups increase with age, especially among women. For example, the probability of a first marriage among all race and Hispanic origin groups by age 18 is 10% or less. However, by age 40, the differences are greater: there is a 90% probability that non-Hispanic white women will have married for the first time compared with only a 63% probability for non-Hispanic black women. Data for Hispanic and non-Hispanic black men are not shown for age 40 due to insufficient sample size.
Hispanic women have a higher probability of marriage by age 18 (10%) than non-Hispanic white women (6%) or non-Hispanic black women (3%). Hispanic and non-Hispanic white women have a higher probability of marrying for the first time between the ages of 18 and 30 than their male counterparts. Non-Hispanic black women have a higher probability than non-Hispanic black men of marrying for the first time only by age 18. In fact, after age 30, the data suggest that non-Hispanic black men have higher probabilities of first marriage than non-Hispanic black women.
Who has not married by age 35 and by age 40?
Although the majority of men and women aged 35-44 have entered their first marriages by age 35, lower percentages of men have done so than women. Seventeen percent of women and 25% of men have not married by age 35.
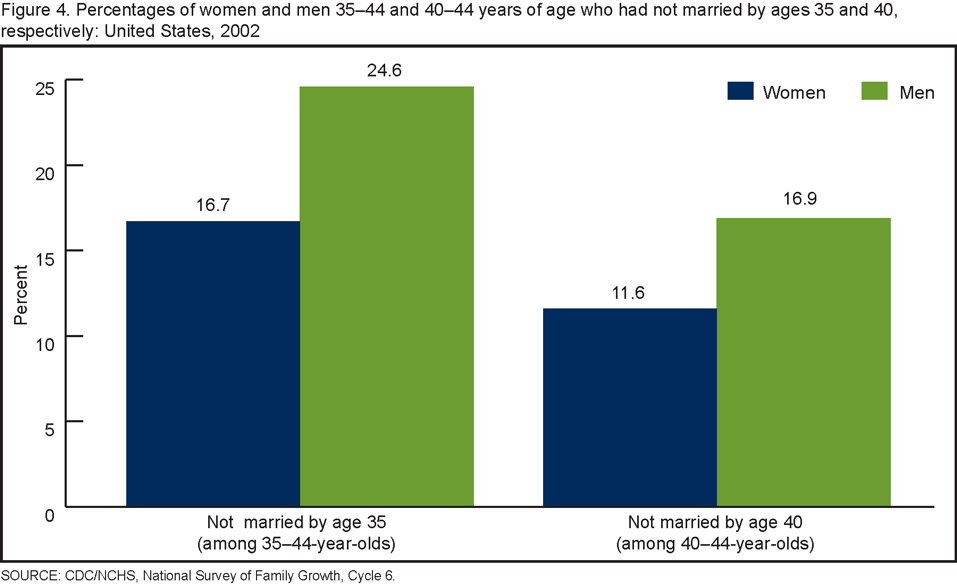
Lower percentages of men aged 40-44 have married by age 40 compared with women aged 40-44. While 12% of women have not married by age 40, 17% of men have not married by age 40.
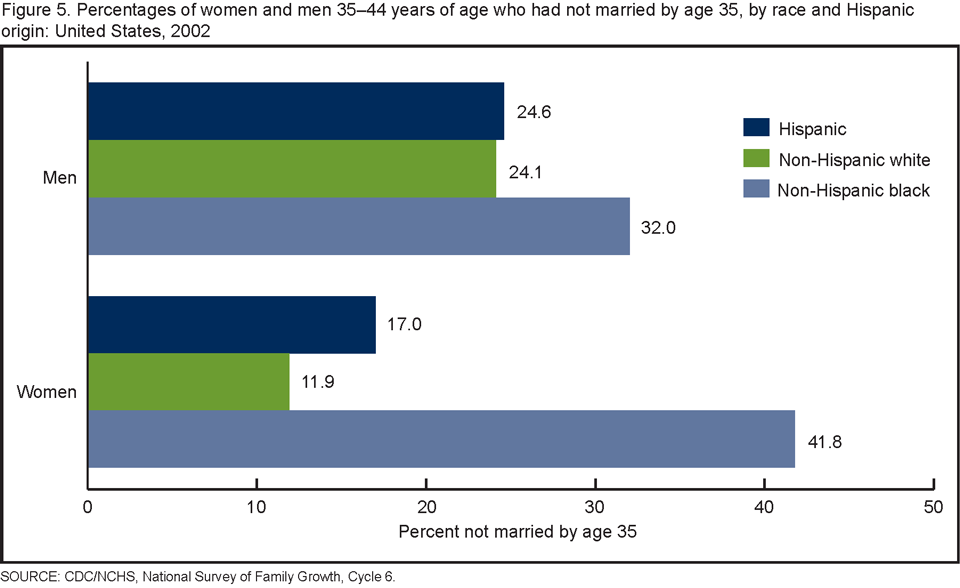
Among women aged 35-44 years, higher percentages of non-Hispanic black women have not married by age 35 compared with non-Hispanic white and Hispanic women. While 17% of Hispanic and 12% of non-Hispanic white women have not married by age 35, 42% of non-Hispanic black women have not married by this age.
There are no significant differences in the percentages of Hispanic, non-Hispanic white, and non-Hispanic black men aged 35-44 years who have not married by age 35. Thirty-two percent of non-Hispanic black men have not married by age 35 compared with 24% of non-Hispanic white and 25% of Hispanic men.
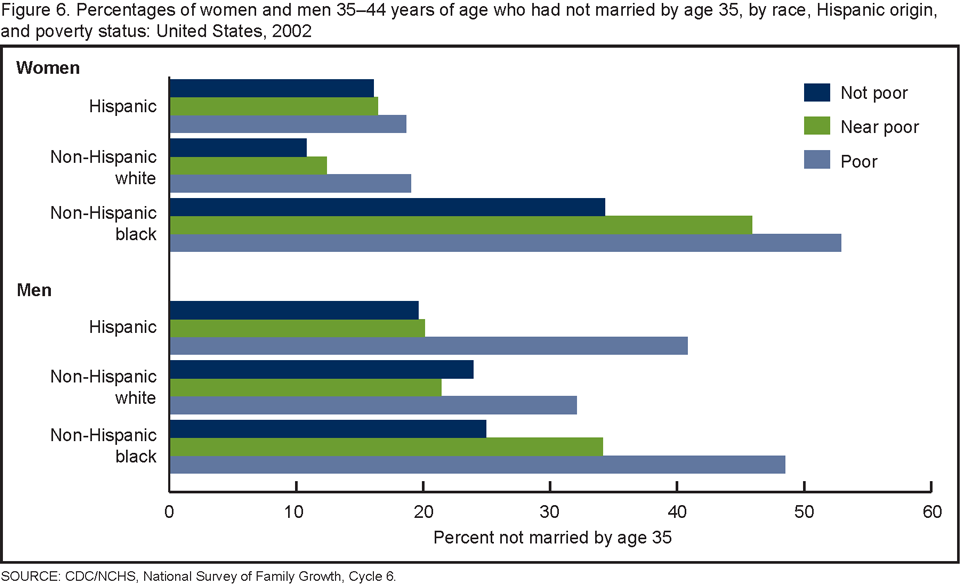
Among all race and ethnic groups aged 35-44, the data suggest that larger percentages of poor women have not married by age 35 than women who are near poor or not poor. Among women 35-44 years of age below the poverty level, larger percentages of non-Hispanic black women have not married by age 35 than Hispanic or non-Hispanic white women. Fifty-three percent of poor non-Hispanic black women aged 35-44 have not married before age 35 compared with 19% of poor Hispanic and non-Hispanic white women of the same age group.
Larger percentages of poor non-Hispanic black men aged 35-44 have not married by age 35 than not-poor non-Hispanic black men (200% or more above poverty). Although not significant, the data suggest that a higher percentage of poor Hispanic men have not married by age 35 than Hispanic men who are not poor. The proportions of non-Hispanic white men who have not married by age 35 are similar across poverty statuses.
Summary
According to these analyses, the majority of men and women will marry at some point: The probability that men and women will marry by age 40 is over 80%. Important differences arise, however, in the timing of first marriage. Women tend to marry at younger ages than men, and fewer non-Hispanic black men and women have been married at all ages relative to non-Hispanic white and Hispanic men and women. Marriage is uncommon for all groups in the teen years, but disparities in the probability of first marriage between the race groups increase with age. Non-Hispanic white women have a 90% probability of having married for the first time by age 40, compared with a 63% probability for non-Hispanic black women.
Overall, greater percentages of men have not married by age 35 than women. Although being poor is associated with greater proportions of men and women not marrying by age 35, there are again racial and ethnic variations. Greater percentages of poor non-Hispanic black men aged 35-44 have not married by age 35 than those who are at least 200% above the poverty level. Although the data suggest a similar trend for non-Hispanic white and Hispanic men, poverty status was not significantly related to marriage by age 35 for them.
Definitions
Age at first marriage: The respondent’s age in completed years at first formal (or legal) marriage with a person of the opposite sex.
Hispanic origin and race: Respondents are classified as Hispanic, non-Hispanic white (single race), non-Hispanic black or African American (single race), and other (including non-Hispanic Asian, non-Hispanic American Indian or Alaska Native, non-Hispanic Native Hawaiian or other Pacific Islander, and multiple races). For convenience in writing, non-Hispanic black is used instead of the full phrase, “non-Hispanic black or African American, single race.” Similarly, the term “non-Hispanic white” is used instead of the full phrase, “non-Hispanic white, single race.”
Marital status: The categories of “ever-married” and “currently married” refer to the formal (or legal) marital status of the respondent. “Ever-married” respondents, for example, are those who have ever been formally or legally married to a person of the opposite sex, including respondents who are currently married, divorced, widowed, or separated.
Poverty status: The poverty index ratio (calculated by dividing the total family income by the weighted average threshold income of families whose head of household was under 65 years of age, based on the 2001 poverty levels defined by the U.S. Census Bureau) was used to determine the poverty statuses of respondents. Respondents having a poverty index ratio of 99 or less were classified as “poor.” Those whose income was 100%-199% of poverty were considered “near poor,” and those with incomes 200% or above the poverty level were “not poor.”
Probability of first marriage by selected ages: The probability or chance that an individual has entered his or her first marriage by various ages was calculated using a life table methodology. This methodology uses age-specific marriage rates to calculate how many individuals of a cohort will experience an event (i.e., first marriage) during an interval. The probabilities produced by life table methodology do not represent the actual percentages of individuals who have married by each age shown; instead, they represent how likely it is that an individual will marry by a specified age, given the age-specific marriage rates observed for this NSFG-based cohort. For example, a probability of first marriage of 0.90 by age 40 for non-Hispanic white women means that by age 40 there is a 90% probability that non-Hispanic white women will have married for the first time.
Data source and methods
Analyses shown here were conducted using the 2002 National Survey of Family Growth (Cycle 6) a nationally representative sample of the household population 15-44 years of age. The sample consists of 12,571 respondents: 4,928 males and 7,643 females (see Groves et al. (9) for more detailed information on the NSFG). This report shows findings by characteristics of the respondent at the time of the interview, including age, sex, race and Hispanic origin, and poverty level income. Poverty level income at interview may not reflect respondents’ poverty status at the time of first marriage.
Statistical analyses were conducted using SAS System for Windows, version 9.1 (www.sas.com). Percentages, probabilities, and medians presented here are weighted national estimates that account for different sampling rates and for nonresponse bias and are adjusted to agree with population control totals provided by the U.S. Census Bureau (see Lepkowski, et al. (10) for detailed information about sampling and weighting procedures).
Standard errors were calculated, and tests of significance performed, for selected comparisons in this report. The statistical package SUDAAN (www.rti.org/sudaan) was used for the calculation of standard errors, because it takes into account complex sample designs such as that of the NSFG. Significance of differences between subgroups was determined by two-tailed t-tests at the 5 percent level. No adjustments were made for multiple comparisons. Lack of comment regarding the difference between any two statistics does not mean that significance was tested and ruled out.
About the authors
Paula Goodwin and Brittany McGill were formerly with the Centers for Disease Control and Prevention’s National Center for Health Statistics, Division of Vital Statistics, Reproductive Statistics Branch. Anjani Chandra is with the Centers for Disease Control and Prevention’s National Center for Health Statistics, Division of Vital Statistics, Reproductive Statistics Branch.
References
- Kreider RM. Number, timing, and duration of marriages and divorces: 2001. Current Population Reports, P70-97. U.S. Census Bureau, Washington, DC. 2005.
- U.S. Census Bureau. Annual social and economic supplement: 2003 Current Population Survey. Current Population Reports, Series P20-553, America’s families and living arrangements: 2003. Washington, DC. 2004.
- Schoenborn CA. Marital status and health: United States, 1999-2002. Advance data from vital and health statistics; no 351. Hyattsville, MD: National Center for Health Statistics. 2004.
- Waite LJ. Does marriage matter? Demography 32(4):483-507. 1995.
- Wood RG, Goesling B, Avellar S. The effects of marriage on health: A synthesis of recent research evidence. Report prepared for the Department of Health and Human Services by Mathematica Policy Research, Inc. 2007. Available from: The Effects of Marriage on Health: A Synthesis of Recent Research Evidence [PDF – 297 KB]
- McLanahan S, Sandefur G. Growing up with a single parent: What hurts, what helps. Cambridge: Harvard University Press. 1994.
- Wu LL, Wolfe BW. Out of wedlock: Causes and consequences of nonmarital fertility. New York: Sage. 2001.
- Department of Health and Human Services, Administration for Children and Families. Available from: http://www.acf.hhs.gov/healthymarriage/. Accessed June 23, 2008.
- Groves RM, Benson G, Mosher WD, et al. Plan and operation of cycle 6 of the National Survey of Family Growth. Vital Health Stat 1(42). Hyattsville, MD: National Center for Health Statistics. 2005.
- Lepkowski JM, Mosher WD, Davis KE, Groves RM, van Hoewyk J, Willem J. National Survey of Family Growth, Cycle 6: Sample design, weighting, imputation, and variance estimation. Vital Health Stat 2(142). Hyattsville, MD: National Center for Health Statistics. 2006.
Suggested Citation
Goodwin P, McGill B, Chandra A. Who marries and when? Age at first marriage in the United States, 2002. NCHS data brief, no 19. Hyattsville, MD: National Center for Health Statistics. 2009.
Copyright information
All material appearing in this report is in the public domain and may be reproduced or copied without permission; citation as to source, however, is appreciated.
National Center for Health Statistics
Director
Edward J. Sondik, Ph.D.
Acting Co-Deputy Directors
Jennifer H. Madans, Ph.D
Michael H. Sadagursky
- Page last reviewed: November 6, 2015
- Page last updated: June 30, 2009
- Content source: