

Births in the United States, 2013
 ShareCompartir
On This Page
- Key findings
- The number and rate of births declined in the United States in 2013.
- Birth rates declined for 2012–2013 for women under age 30 and rose for women in most age groups 30 and over.
- In 2013, non-Hispanic white women had a lower cesarean delivery rate than non-Hispanic black and Hispanic women.
- Preterm birth rates dropped across the country during 2006–2013.
- Following several years of stability, the rate of twin births rose in the United States for 2013.
- Summary
- Definitions
- Data sources and methods
- About the authors
- References
- Suggested citation
NCHS Data Brief No. 175, December 2014
PDF Version (612 KB)
Joyce A. Martin, M.P.H; Brady E. Hamilton, Ph.D.; and Michelle J.K. Osterman, M.H.S.
Key findings
Data from the National Vital Statistics System
- There were 3.93 million births in the United States in 2013, down less than 1% from 2012 and 9% from the 2007 high. The U.S. general fertility rate was at an all-time low in 2013.
- Birth rates dropped to record lows in 2013 among women under age 30 and rose for most age groups 30 and over.
- The cesarean delivery rate declined less than 1% from 2012 to 2013, to 32.7% of births. This rate rose nearly 60% from 1996 to 2009, but was down slightly from the 2009 high.
- The 2013 preterm birth rate was 11.39%, down 1% from 2012 and 11% from the 2006 peak. Declines in preterm rates since 2006 were reported across the United States.
- The twin birth rate, which had been mostly stable for 2009–2012, rose 2% in 2013 to 33.7 per 1,000 births.
This report presents 2013 final birth data on several key demographic and maternal and infant health indicators. Trends in the number of births, general fertility rates, age-specific birth rates, and cesarean delivery rates by race and Hispanic origin, as well as trends in preterm births by state and trends in twin births are explored, with special focus on the most current period, 2012–2013. A previous report presented 2013 preliminary data on selected topics (1). Data are from the annual national natality files, representing 100% of births to U.S. residents.
Keywords: general fertility rate, cesarean delivery, preterm births, twins
The number and rate of births declined in the United States in 2013.
- The number of U.S. births declined in 2013 for the sixth straight year to 3,932,181, down less than 1% from 2012 and 9% from the 2007 peak (Figure 1).
Figure 1. Live births and general fertility rates, by selected race and Hispanic origin of mother: United States, 2007, 2012, and 2013
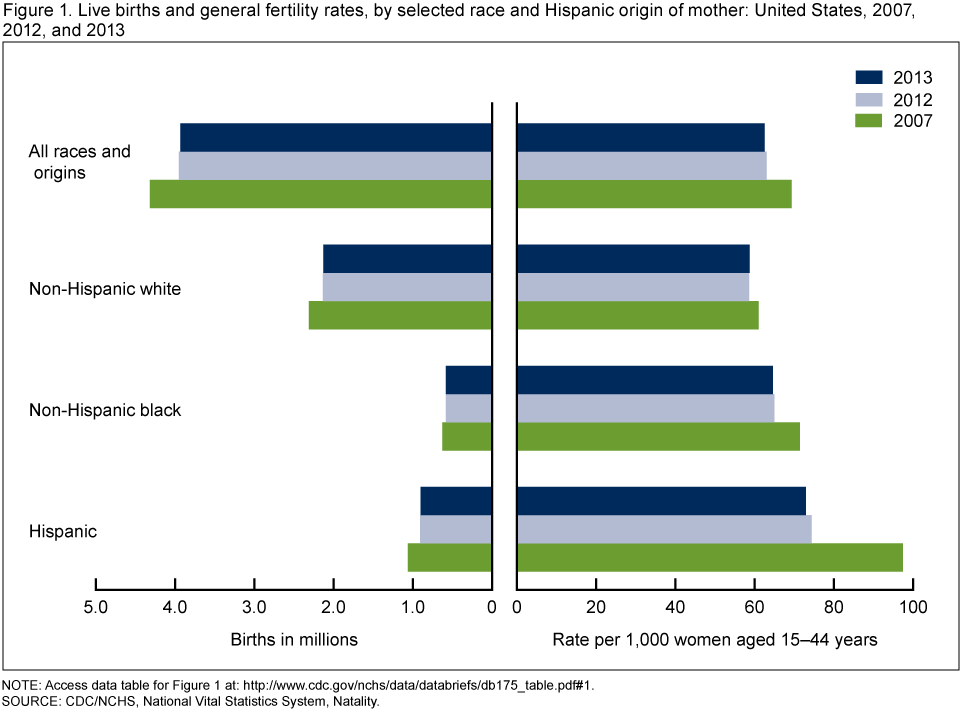
NOTE: Access data table for Figure 1.
SOURCE: CDC/NCHS, National Vital Statistics System, Natality.
- Births declined 1% or less for non-Hispanic white and Hispanic women from 2012 to 2013, but did not appreciably change for non-Hispanic black women. The number of births has declined for each of these groups since 2007.
- The U.S. general fertility rate (GFR) declined 1% in 2013, to another record low: 62.5 per 1,000 women aged 15–44 (2). Since 2007, the fertility rate has declined 10%.
- General fertility rates were down 1% for non-Hispanic black and 2% for Hispanic women from 2012 to 2013, but rose slightly (less than 1%) for non-Hispanic white women. GFRs declined for all race and Hispanic origin groups from 2007 through 2013.
Birth rates declined for 2012–2013 for women under age 30 and rose for women in most age groups 30 and over.
- Birth rates for women under age 30 reached record lows in 2013 (2). Rates fell 10% to 26.5 per 1,000 among teenagers, 3% to 80.7 births for women aged 20–24, and 1% to 105.5 births for women aged 25–29. Birth rates for women under age 25 have generally declined over the last two decades (Figure 2).
Figure 2. Birth rates, by selected age of mother: United States, 1990–2013
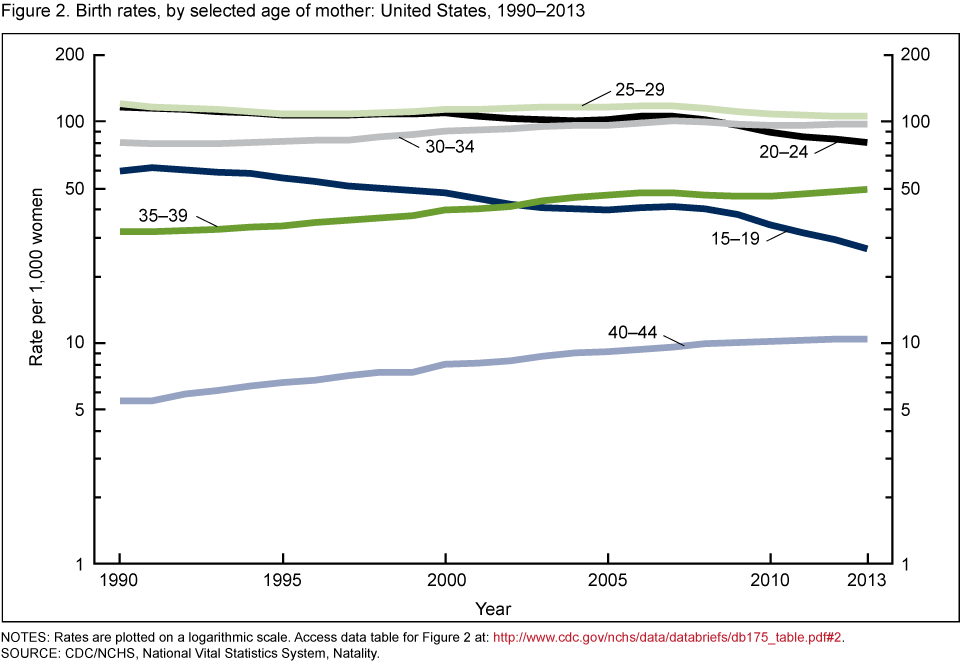
NOTES: Rates are plotted on a logarithmic scale. Access data table for Figure 2.
SOURCE: CDC/NCHS, National Vital Statistics System, Natality.
- In contrast, birth rates for women aged 30 and over generally rose in 2013. From 2012 to 2013, birth rates for women aged 30–34 and 35–39 rose by 1% and 2%, respectively, to 98.0 and 49.3 births per 1,000. The rate for women aged 40–44 was unchanged at 10.4; the rate for women aged 45–49 increased from 0.7 to 0.8 per 1,000. Childbearing among women aged 30 and over has generally risen over the last three decades (2) (see Data table for Figure 2 for rates for women aged 45 and over).
In 2013, non-Hispanic white women had a lower cesarean delivery rate than non-Hispanic black and Hispanic women.
- The cesarean delivery rate declined slightly in 2013, to 32.7% of U.S. births from 32.8% for 2010–2012 (Figure 3). The rate peaked in 2009 at 32.9%.
Figure 3. Cesarean delivery, by race and Hispanic origin: United States, 1990–2013
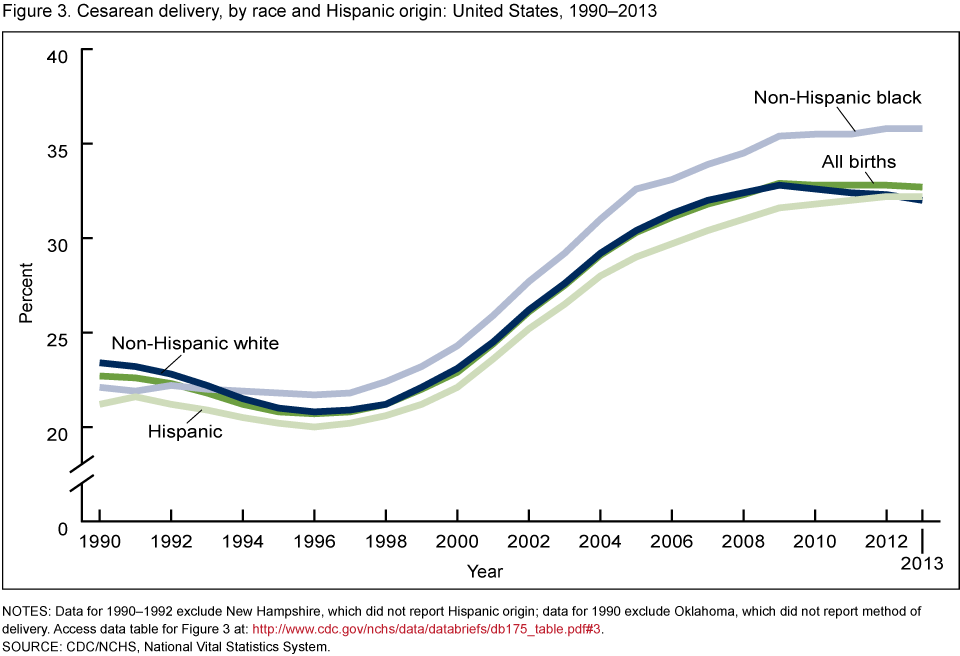
NOTES: Data for 1990–1992 exclude New Hampshire, which did not report Hispanic origin; data for 1990 exclude Oklahoma, which did not report method of delivery. Access data table for Figure 3.
SOURCE: CDC/NCHS, National Vital Statistics System.
- Changes in cesarean delivery rates varied by race and Hispanic origin. The rate for non-Hispanic white women declined for the fourth consecutive year, to 32.0% in 2013, down 2% from the 2009 peak of 32.8%.
- Rates of cesarean delivery remained unchanged for non-Hispanic black (35.8%) and Hispanic (32.2%) women in 2013. In contrast to the trend for non-Hispanic white women, rates for non-Hispanic black and Hispanic women have risen slightly since 2009.
- As a result of the differing trends, the 2013 cesarean delivery rate for non-Hispanic white women was lower than that of Hispanic women, which was historically the group with the lowest rate. Non-Hispanic black women continued to have the highest rate of cesarean delivery.
Preterm birth rates dropped across the country during 2006–2013.
- The U.S. preterm birth rate was 11.39% in 2013, a decline of 1% from 2012 (11.55%) (3) and 11% from the peak in 2006 (12.80%).
Figure 4. Percent change in preterm birth rates, by state: United States, 2006 and 2013
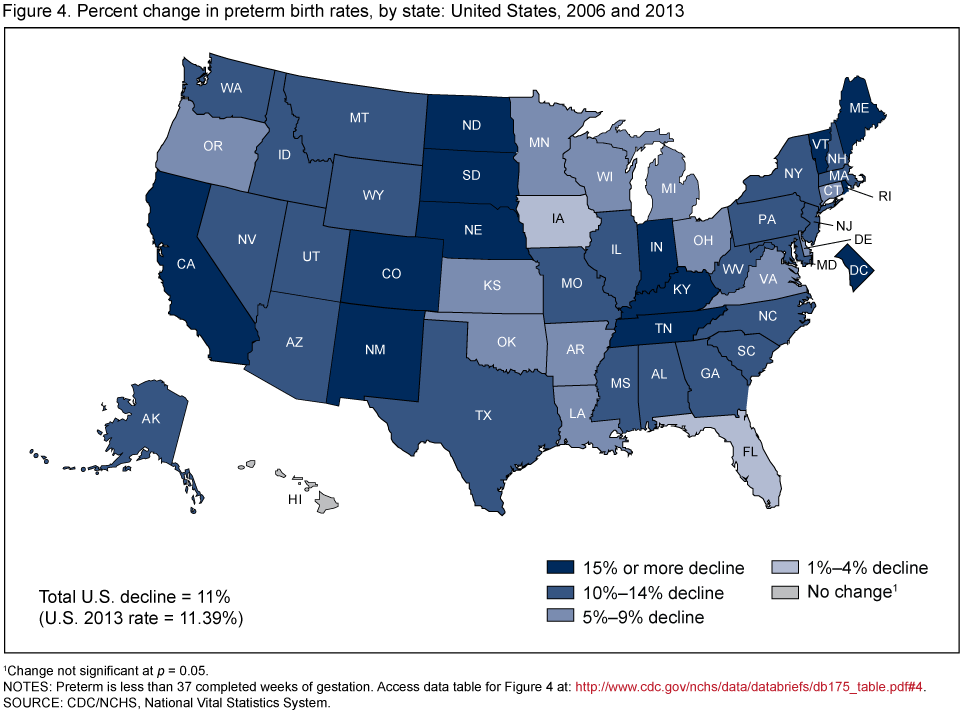
1Change not significant at p = 0.05.
NOTES: Preterm is less than 37 completed weeks of gestation. Access data table for Figure 4.
SOURCE: CDC/NCHS, National Vital Statistics System.
- Reductions in preterm birth rates were reported across the United States during 2006–2013 (Figure 4). Rates declined in 49 states and the District of Columbia; the change for Hawaii was not statistically significant.
- Twelve states and the District of Columbia reported declines in preterm rates of 15% or more; 23 additional states reported 10%–14% declines.
Following several years of stability, the rate of twin births rose in the United States for 2013.
- There were 132,324 births in twin deliveries in 2013. The number of twin births more than doubled from 1980 through 2009, rising from 68,339 to more than 137,000 births each year 2006 to 2009 (Figure 5).
Figure 5. Number and rate of twin births: United States, 1980–2013
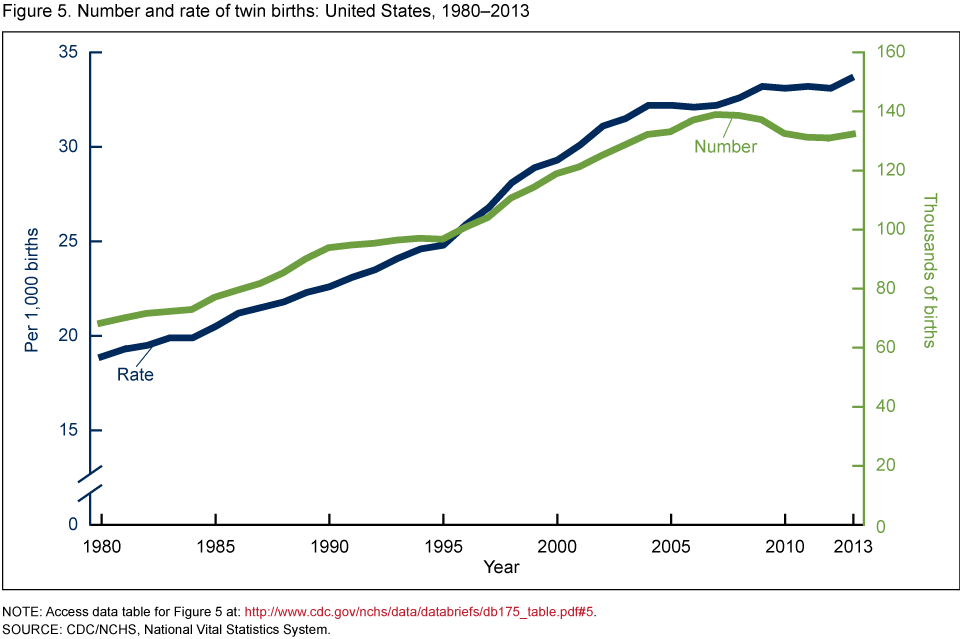
NOTE: Access data table for Figure 5.
SOURCE: CDC/NCHS, National Vital Statistics System.
- One in every 30 babies born in the United States was a twin in 2009–2013, compared with 1 in every 53 newborns in 1980.
- The twin birth rate, which had been essentially flat for 2009–2012, rose 2% in 2013 to 33.7 per 1,000 (or 3.7% of all births). This rate rose by 76% during 1980–2009, from 18.9 to 33.2 per 1,000.
Summary
Childbearing is on the decline in the United States overall and among women under age 30 and women in each of the largest race and Hispanic origin groups. Childbearing continues to rise among older women, however, with rates for women aged 35 and over at the highest levels seen in approximately 50 years (2). After more than a decade of steady rises, cesarean delivery rates are trending slightly downward; a recent report revealed larger declines for 2009–2013 among women at low risk for cesarean delivery than for all women with cesareans (4). Following several years of relative stability, twinning rates were up for 2013; a recent report based on 2012 data revealed that triplet and higher-order multiple births have been trending sharply downward 3). Declines in the incidence of preterm deliveries, especially in conjunction with reductions in low birthweight (albeit modest) (3) and in perinatal mortality (5), suggest some recent progress in improving pregnancy outcome in the United States. The forthcoming report “Births: Final Data for 2013” will present more information on the topics addressed in this report and selected others (6).
Definitions
General fertility rate: Number of births per 1,000 women aged 15–44.
Cesarean delivery rate: Number of births delivered by cesarean per 100 births.
Preterm birth rate: Births delivered prior to 37 completed weeks of gestation per 100 births.
Twin birth rate: Number births in a twin delivery per 1,000 total births.
Data sources and methods
This report contains data from the Natality Data File from the National Vital Statistics System (NVSS). The vital statistics Natality File is based on information derived from birth certificates and includes information for all births occurring in the United States. This report accompanies the release of the 2013 natality public-use file (7). More detailed analysis of the topics presented in this report in addition to many others including births to unmarried women, prenatal care, tobacco use during pregnancy, source of payment for the delivery, pregnancy risk factors, maternal morbidity, and breastfeeding is possible by using the annual natality files (7).
References to increases or decreases in rates indicate differences are statistically significant at p = 0.05 level. Computations exclude records for which information is unknown.
About the authors
Joyce A. Martin, Brady E. Hamilton, and Michelle J.K. Osterman are with CDC’s National Center for Health Statistics, Division of Vital Statistics, Reproductive Statistics Branch.
References
- Hamilton BE, Martin JA, Osterman MJK. Births: Preliminary data for 2013. National vital statistics reports; vol 63 no 2. Hyattsville, MD: National Center for Health Statistics. 2014.
- National Center for Health Statistics. Vital statistics of the United States, 2003, volume I, natality.
- Martin JA, Hamilton BE, Osterman MJK, et al. Births: Final data for 2012. National vital statistics reports; vol 62 no 9. Hyattsville, MD: National Center for Health Statistics. 2014.
- Osterman MJK, Martin JA. Trends in low-risk cesarean delivery in the United States. National vital statistics reports; vol 63 no 6. Hyattsville, MD: National Center for Health Statistics. 2014.
- Gregory ECW, MacDorman MF, Martin JA. Trends in fetal and perinatal mortality in the United States, 2006–2012. NCHS data brief, no 169. Hyattsville, MD: National Center for Health Statistics. 2014.
- Martin JA, Hamilton BE, Osterman MJK, et al. Births: Final data for 2013. National vital statistics reports. Hyattsville, MD: National Center for Health Statistics. Forthcoming.
- National Center for Health Statistics. Vital statistics data available online. Natality public-use file and CD–ROM. Hyattsville, MD: National Center for Health Statistics. Published annually.
Suggested citation
Martin JA, Hamilton BE, Osterman MJK. Births in the United States, 2013. NCHS data brief, no 175. Hyattsville, MD: National Center for Health Statistics. 2014.
Copyright information
All material appearing in this report is in the public domain and may be reproduced or copied without permission; citation as to source, however, is appreciated.
National Center for Health Statistics
Charles J. Rothwell, M.S., M.B.A., Director
Jennifer H. Madans, Ph.D., Associate Director for Science
Division of Vital Statistics
Delton Atkinson, M.P.H., M.P.H., P.M.P., Director
- Page last reviewed: November 6, 2015
- Page last updated: December 4, 2014
- Content source: