

Chapter 5 Figures
 ShareCompartir
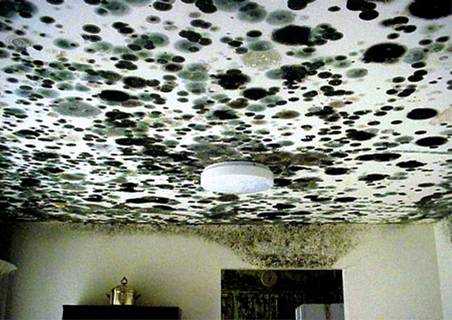
Figure 5.1. Mold Growth in the Home
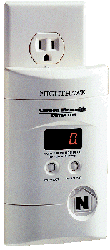
Figure 5.2. Home Carbon Monoxide Monitor
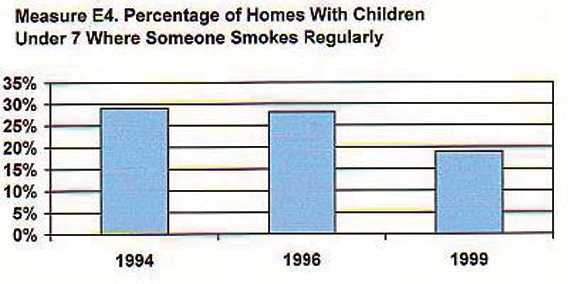
Figure 5.3. Environmental Tobacco Smoke and Children’s Exposure
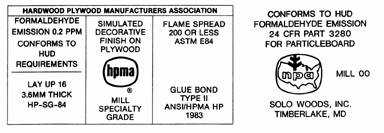
Figure 5.4. Wood Products Label
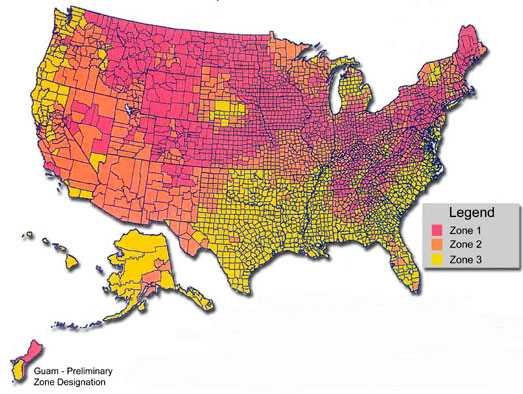
Figure 5.5. EPA Map of Radon Zones
Zone 1: predicted average indoor radon screening level greater than 4 pCi/L (picocuries per liter); Zone 2: predicted average indoor radon screening level between 2 and 4 pCi/L; and Zone 3: predicted average indoor radon screening level less than 2 pCi/L.
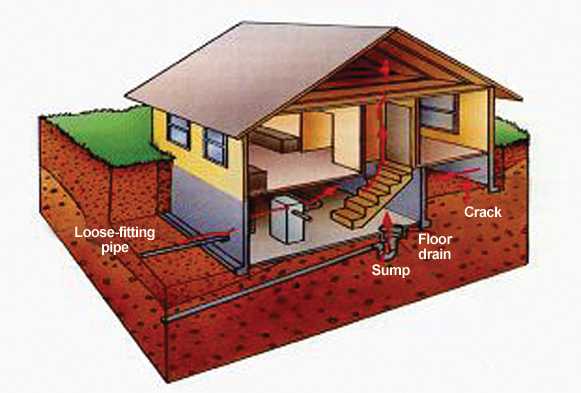
Figure 5.6. Radon Entry
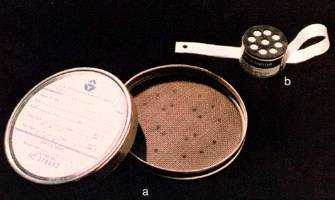
Figure 5.7. Home Radon Detectors
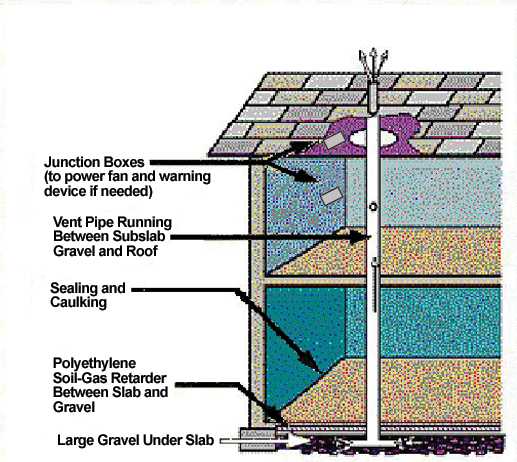
Figure 5.8. Radon-resistant Construction
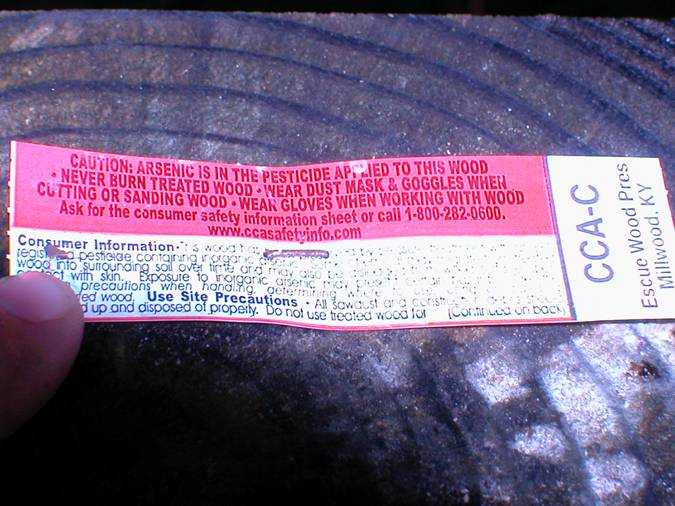
Figure 5.9. Arsenic Label
- Page last reviewed: October 1, 2009
- Page last updated: December 8, 2009
- Content source: