

Lyme disease graphs
 ShareCompartir
Reported Cases of Lyme Disease by Year, United States, 1995-2015
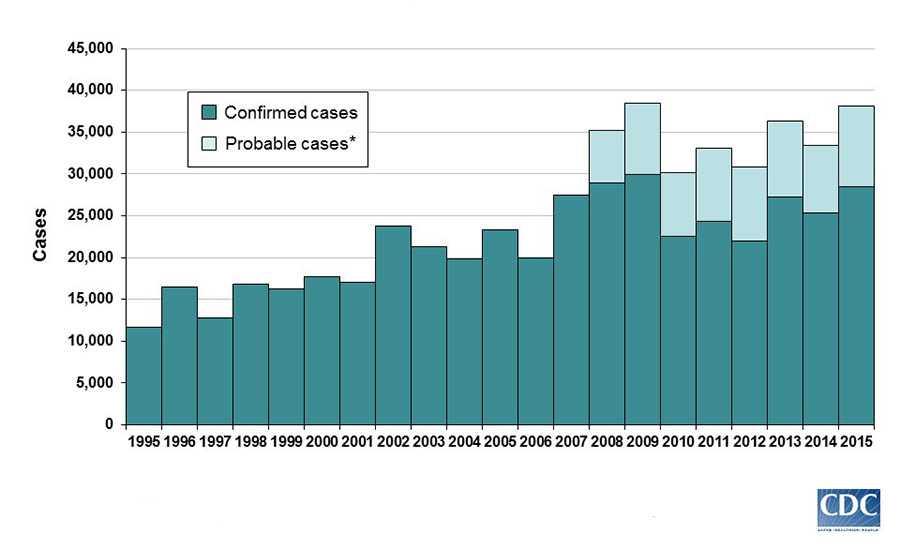
The graph displays the number of reported cases of Lyme disease from 1995 through 2015.
*National Surveillance case definition revised in 2008 to include probable cases.
Confirmed Lyme disease cases by age and sex–United States, 2001-2015
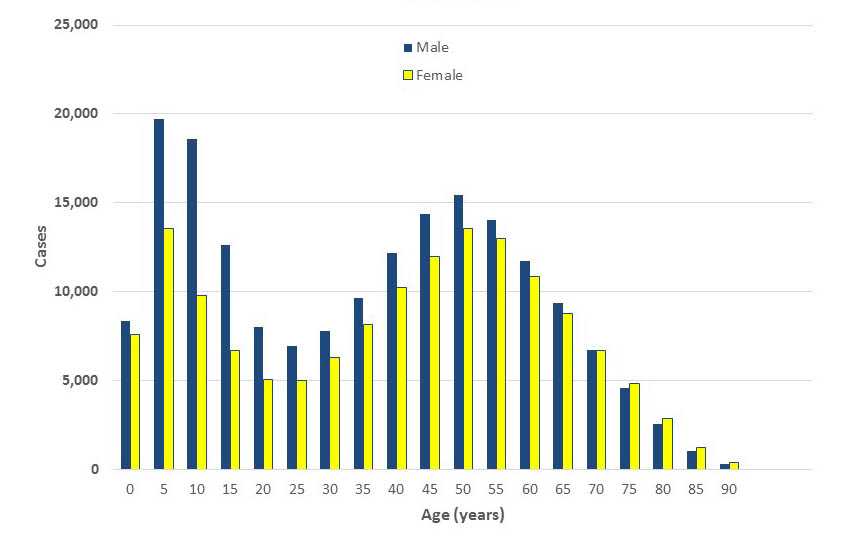
Reported cases of Lyme disease are most common among boys aged 5-9.
Confirmed Lyme disease cases by month of disease onset–United States, 2001-2015
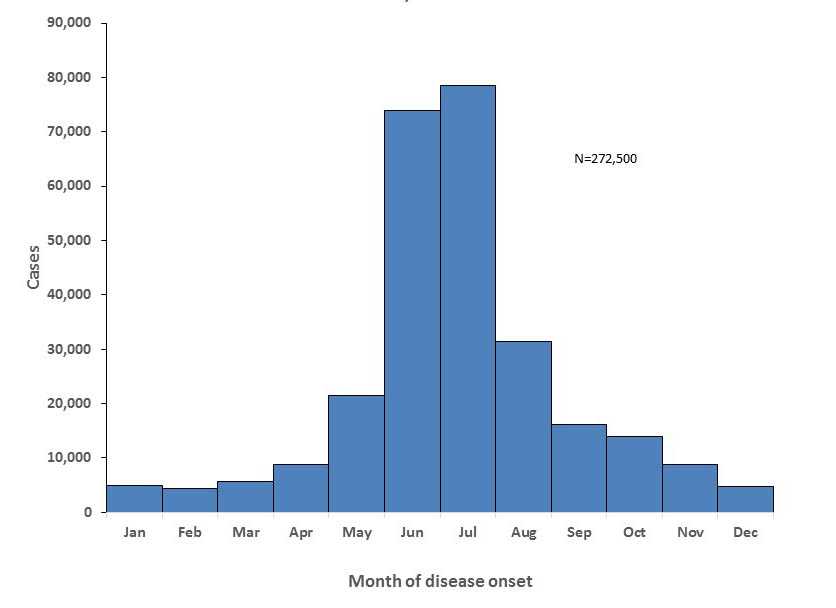
Lyme disease patients are most likely to have illness onset in June, July, or August and less likely to have illness onset from December through March.
Clinical Manifestations of Confirmed Lyme Disease Cases–United States, 2001-2015
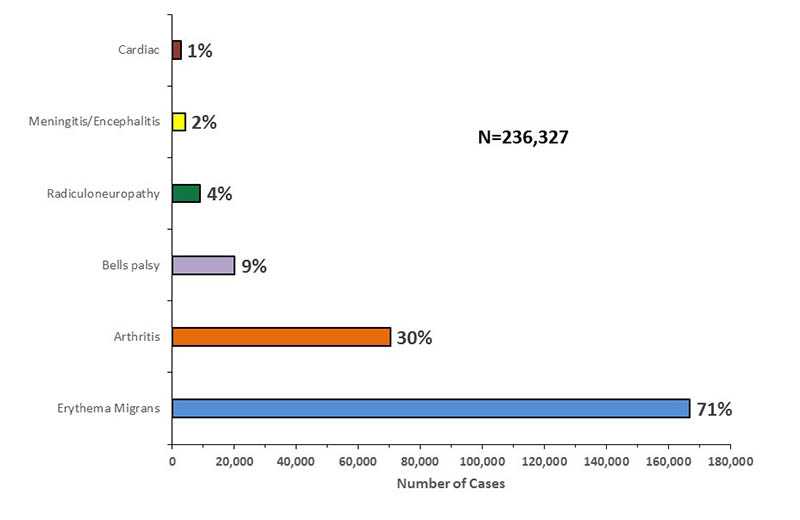
This figure represents the breakdown of reported Lyme disease cases from 2001 to 2015 by disease manifestation. The majority of cases are the erythema migrans (EM) rash. Other manifestations are less common, some patients have more than one presentation.
- Page last reviewed: November 21, 2016
- Page last updated: November 21, 2016
- Content source: