

Attribution of Foodborne Illnesses, Hospitalizations, and Deaths to Food Commodities by using Outbreak Data, United States, 1998–2008
 ShareCompartir
EID Journal Article
This study provided a comprehensive set of estimates of how much foodborne illness is accounted for by each of 17 food categories, called “commodities” in the paper. These are our most comprehensive estimates available to answer the question: which foods make us ill?
Each year, roughly 48 million people (1 in 6) get sick from food eaten in the United States. Although major pathogens account for more than 9 million of these sicknesses, linking individual illnesses to a particular food is rarely possible except during an outbreak.
1, 2, 3, and 4. Table 4 provides researchers access to estimated percentages of foodborne illnesses caused by each pathogen that were attributed to each food commodity, by etiology.
Podcast: Listen Now or Download MP3 Length: 13:47
Media Advisory: CDC releases first estimates of the food sources of all foodborne illnesses acquired in the United States
What is this study about?
This study addresses the important question: Which foods make us ill?
For the first time, CDC developed a comprehensive set of estimates of the food sources of all foodborne illnesses acquired in the United States. The paper provides a historical baseline of estimates that will be further refined over time with more data and improved methods.
It builds on the estimates of foodborne illness published in 2011 that told us that about 48 million people (1 in 6) get sick each year from food. More than 9 million of these illnesses are caused by major pathogens [1 page] CDC tracks.
The paper focuses on known causes of illness and uses data from nearly 4600 outbreaks to estimate the number of illnesses attributed to each of 17 food categories (called “commodities” in the paper). This is the first time CDC has attempted such a comprehensive set of estimates.
Why is this paper is important?
This study offers the most comprehensive look to date in attributing illness to specific food commodities based on outbreak data, including those where complex foods (that is, foods that have ingredients from several food categories) were implicated in outbreaks.
Figure B
These findings underscore roles of industry and government that help keep food safe. These attribution estimates are important because they can help regulatory agencies and industry target prevention efforts that will improve the safety of the foods that we need and that we love to eat.
We developed a method of attributing illnesses to specific food groups based on a decade of outbreak data, including those that implicate complex foods (that is, foods that have ingredients from several food categories.) Figure A.
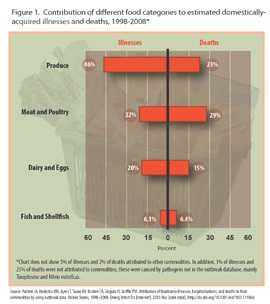
Among all types of foods, produce accounted for nearly half of illnesses, which were most often caused by norovirus. However, the CDC emphasizes that a healthy and safe diet that is high in fruits and vegetables is an important part of a healthy lifestyle. The most common food sources of fatal infections were meat and poultry, much due to Salmonella and Listeria. Figure B
What did the study show?
The estimates used 4,589 foodborne disease outbreaks reported over the 11 year span from 1998 to 2008. Both the contaminant and the specific food causing the outbreak was reported.
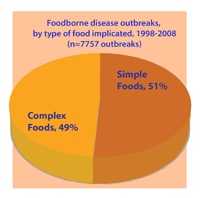
- This included outbreaks linked to a food belonging to a single food category (a “simple” food) as well those linked to foods made from more than one food category (a “complex” food). Figure C
- Half of outbreak investigations with a known food implicate a complex food. Because complex foods have ingredients from more than one food category, they do not fit into the 17 food categories and have not been included in previous analyses. Figure C
Illness was attributed to all the 17 different food categories. The proportion accounted for by each category varied.
- Figure B shows the contributions of different food commodities (categories) to estimated illnesses and deaths.
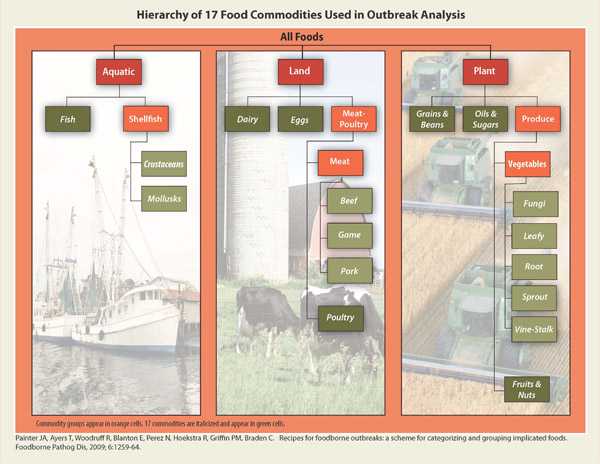
- Figure D shows the main groupings of food categories.
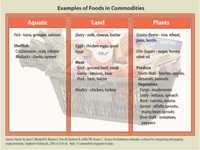
- Figure E gives examples of foods in categories.
Produce (a combination of six plant food categories [Fruits-Nuts, Fungi vegetables, Leafy vegetables, Root vegetables, Sprout vegetables, Vine-Stalk vegetables]) accounted for nearly half of illnesses (46%). Figure E provides examples of foods in these groups.
- Among the individual food categories, leafy vegetables accounted for the most illnesses. Many of those illnesses (46%) were caused by norovirus.
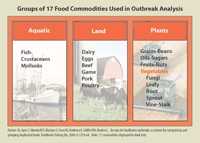
Meat and poultry (a combination of four animal food categories[Beef, Game, Pork, and Poultry) accounted for fewer illnesses, but for 29% of deaths. Figure E provides examples of foods in these groups.
- Poultry accounted for the most deaths (19%); many of those were caused by Listeria and Salmonella infections.
- This is partly due to three large Listeria outbreaks linked to sliced processed turkey that occurred in the last decade, though fewer have occurred in recent years.
Your findings attribute many illnesses from produce to norovirus. Do you know how food became contaminated with norovirus?
This paper does not address where contamination of food occurs along the food production chain. A recent CDC study on “Epidemiology of Foodborne Norovirus Outbreaks, United States, 2001-2008” looked at this issue in relation to norovirus. Here are some of the main findings about the food sources from norovirus:
- Sick food handlers specifically caused 53 percent of the foodborne norovirus outbreaks by contaminating food and may have contributed to another 29 percent of the outbreaks. Over 80 percent of outbreaks involved food prepared in commercial settings, such as restaurants, delis, or catering businesses.
- Among the 364 outbreaks that involved a single contaminated food, over half were produce, primarily leafy vegetables or fruits. These foods, which are commonly eaten raw, were most often contaminated during preparation or service by a sick food handler. A few outbreaks were caused by produce that was contaminated during production or processing. Mollusks, such as oysters, were also often involved in outbreaks due to contamination during production.
What are the advantages of using outbreak data to estimate the sources of foodborne illnesses?
Outbreak investigations definitively link illnesses to particular foods and pathogens
- Outbreaks are caused by a wide range of agents, including bacteria, viruses, parasites, toxins, and other chemicals so they provide good coverage of foodborne agents
- Outbreak investigations capture data on common and uncommon pathogens, and on common and uncommon foods
- CDC has a very good outbreak database, Foodborne Outbreak Online Database (FOOD)
What are some of the limitations of the study?
Estimates were not made for pathogens that did not cause outbreaks. Toxoplasma and Vibrio vulnificus did not cause outbreaks but have high fatality rates. Adding these might result in meat and mollusks (e.g., oysters, clams) being more important source of deaths than is indicated in the study.
- The study used data from an 11-year period and did not account for changes over this period. A shorter, more recent period is desirable when major implicated commodities have changed. For example, Listeria outbreaks caused by contamination of ready-to-eat meats markedly decreased after 2002.
- The estimates are presented as ranges of high, low, and most likely estimates for the number of illnesses, hospitalizations and deaths attributed to each food category. The ranges reflect the uncertainty in the estimates.
- The estimates depend on the general assumption that the foods implicated in outbreaks are the same foods that cause individual illnesses not part of outbreaks.
- The risk for foodborne illness is just one part of the risk-benefit equation for foods; the health benefits of consuming a diet high in fruits and vegetables must also be considered.
Does this mean I should not eat produce and poultry?
No, that is not the message from this paper. A healthy and safe diet is an important part of a healthy lifestyle. These findings do not mean that people should avoid certain categories of foods.
- Fruits and Vegetables: The Dietary Guidelines for Americans 2010 encourage us to eat more fruits and vegetables as a part of a healthy diet. Eating fruits and vegetables is associated with reduced risk of many chronic diseases including heart attack, stroke, and certain types of cancer. When properly cleaned, separated, cooked, and stored to limit contamination, fruits and vegetables safely provide some essential nutrients that would otherwise be lacking in most American diets.
- Raw Poultry: Food items, like chicken, often contains harmful bacteria such as Salmonella and Campylobacter. Washing poultry does not remove bacteria.
- Kill these bacteria by cooking chicken to the proper temperature
- Use a food thermometer to ensure that cooked foods reach a safe internal temperature: 165°F for poultry, 145°F for whole meats (allowing the meat to rest for 3 minutes before carving or consuming), and 160°F for ground meats.
What types of additional data and methods are you planning to use to improve the estimates?
The attribution of illness to foods can be done in several different ways, some highly specific for one type of infection or one type of food, and others more general.
- For example, by comparing the characteristics of Salmonella found in foods and animals with those found in people, one can attribute Salmonella infections back to specific animal sources.
- A working group of scientists from CDC, FDA and USDA has been collaborating on several projects to improve these estimates. This Interagency Food Safety Analytics Collaboration (IFSAC) is bringing together more data from across the agencies, and evaluating methods for analyzing them, and will be providing more refined estimates in the future.
Will you ever be able to tell us the top foods that make us sick?
This study goes a long way toward doing that, and CDC is working to refine the estimates. FDA is working to develop the list of the riskiest foods among the foods that they regulate.
- The Interagency Food Safety Analytics Collaboration is developing a more detailed breakdown of foods and food groups (beyond the 17 general categories) that will help in future work. Learn more about IFSAC and their current projects.
How will CDC partners benefit from this study?
The study provides extensive documentation for industry, consumer groups, and researchers to use and review. Regulatory agencies can use these data to conduct risk analyses required in the rulemaking process.
- Outbreak data are used to measure Healthy People 2020 goals. Outbreak data are also used to inform the Food and Drug Administration’s (FDA) regulations, such as the Egg Safety Rule, and provide rationale for adoption of FDA’s recently proposed rules on produce safety standards and preventive controls for human food.
- Outbreak data are used by the US Department of Agriculture, Food Safety and Inspection Service (FSIS) to evaluate control measures for poultry and beef, informed by success in the reduction of E. coli O157 illnesses and are in line with the Agency’s 2011-2016 Strategic Plan.
- Page last reviewed: January 23, 2014
- Page last updated: January 23, 2014
- Content source: