

Burden of Foodborne Illness: Methods and Data Sources
 ShareCompartir
In 2011, Scallan et al. estimated the overall burden of foodborne illness caused by known and unspecified agents1.
This analysis included 31 pathogens known to cause foodborne illness and unspecified agents that cause acute gastroenteritis illnesses (AGI). Scallan et al. also estimated the number of hospitalizations and deaths caused by these illnesses.
Download and print factsheet [6 pages]
Estimating US foodborne illnesses for 31 known foodborne pathogens
For each pathogen2, we gathered data from surveillance systems and corrected for underreporting and under-diagnosis. We then multiplied the adjusted number by the proportion of illnesses that was acquired in the United States (that is, not during international travel) and the proportion transmitted by food to yield an estimated number of illnesses that are domestically acquired and foodborne. Then, we added the estimates for each of the pathogens to arrive at a total, and used an uncertainty model to generate a point estimate and 90% credible interval (upper and lower limits) (Figure 1).
Figure 1. Estimating illnesses for pathogens known to cause foodborne illness, 2011*
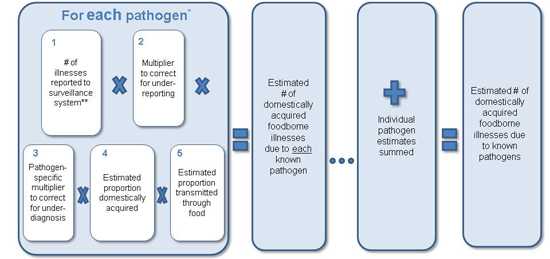
*Probability distributions were used to model uncertainty in each of the data inputs. Point estimates were bounded by a 90% credible interval.
**For six of the 31 pathogens, no routine surveillance data were available so alternative approaches were used to estimate illnesses.
Estimating US foodborne illnesses for unspecified agents
Unspecified agents fall into four general categories:
- Agents with insufficient data to estimate agent-specific burden
- Known agents not yet recognized as causing foodborne illness
- Microbes, chemicals, or other substances known to be in food whose pathogenicity is unproven
- Agents not yet described
To estimate foodborne illnesses from unspecified agents, we used symptom-based data from surveys to estimate the total number of AGI and then subtracted the number of illnesses accounted for by known gastroenteritis pathogens. We then multiplied this number by the proportion of domestically acquired illnesses and of illnesses attributable to food, just as we did for the known agents. Finally, again as with the known-pathogens estimate, we used an uncertainty model to generate a point estimate and 90% credible interval (upper and lower limits) (Figure 2).
Foodborne illnesses due to chemicals that cause acute gastroenteritis are included in the estimate of illnesses due to unspecified agents. However, chemicals or unspecified agents that do not cause acute gastroenteritis are not included in the estimates.
Figure 2. Estimating foodborne illnesses due to unspecified agents, 2011*
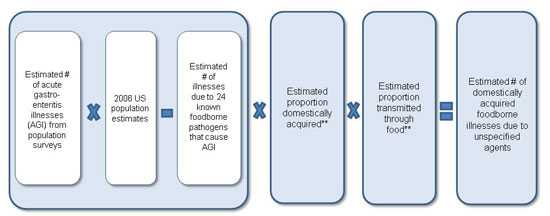
*Probability distributions were used to model uncertainty in each of the data inputs. Point estimates were bounded by a 90% credible interval.
**Estimated proportions were based on the 24 known pathogens that cause acute gastroenteritis illnesses.
Estimating hospitalizations and deaths from US foodborne illnesses due to known pathogens
For each known pathogen with surveillance data available, we multiplied the estimated number of reported illnesses (after correcting for underreporting) by the pathogen-specific hospitalization and death rate from surveillance data, surveys, or outbreak data. Because some people with illnesses that were not laboratory-confirmed would also have been hospitalized and died, we doubled the estimates to correct for under-diagnosis. We multiplied the adjusted hospitalization and death estimates by the proportion of illnesses that were acquired within the United States (vs. international travel-related) and the proportion transmitted by food. Finally, we used an uncertainty model to generate a point estimate and 90% credible intervals for both hospitalizations and deaths (Figures 3 and 4).
Figure 3. Estimating hospitalizations from foodborne illnesses due to known pathogens, 2011*
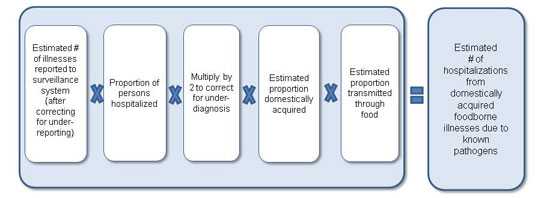
*Probability distributions were used to model uncertainty in each of the data inputs. Point estimates were bounded by a 90% credible interval.
Figure 4. Estimating deaths from foodborne illnesses due to known pathogens, 2011*
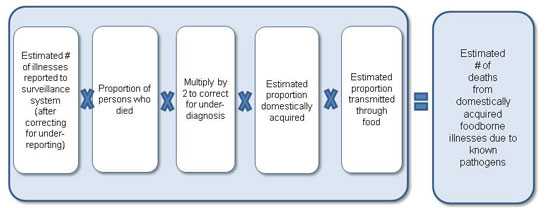
*Probability distributions were used to model uncertainty in each of the data inputs. Point estimates were bounded by a 90% credible interval.
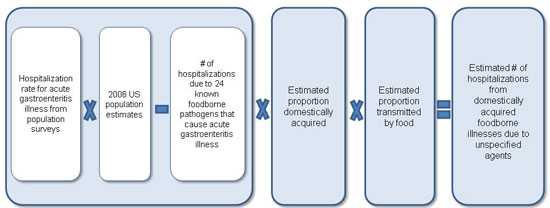
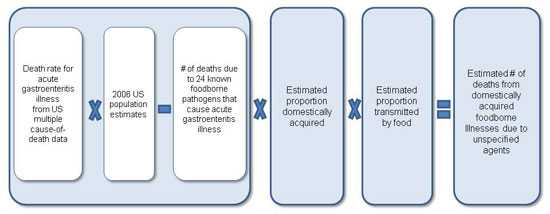
Estimating hospitalizations and deaths from US foodborne illnesses due to unspecified agents
To estimate hospitalizations, we applied the average hospitalization rate for all AGI, determined from survey data for 2000–2006, to 2006 US population estimates and subtracted the estimated number of hospitalizations caused by the 24 known pathogens that cause AGI. For deaths, we determined the death rate for acute gastroenteritis illnesses from US death certificates (specifically, multiple-cause-of-death data) for 2000–2006 and applied that rate to the 2006 US population estimate. We then subtracted the estimated number of deaths from the 24 known gastroenteritis pathogens. For both hospitalizations and deaths, we multiplied the overall number by the proportion of hospitalizations and deaths from the 24 known gastroenteritis pathogens that was domestically acquired and foodborne. Finally, we used an uncertainty model to generate a point estimate and 90% credible intervals (Figures 5 and 6).
Figure 5. Estimating hospitalizations from foodborne illnesses due to unspecified agents, 2011*
*Probability distributions were used to model uncertainty in each of the data inputs. Point estimates were bounded by a 90% credible interval.
Figure 6. Estimating deaths from foodborne illnesses due to unspecified agents, 2011*
*Probability distributions were used to model uncertainty in each of the data inputs. Point estimates were bounded by a 90% credible interval.
Data Sources for the 2011 Estimates
We used five general types of data sources to create the 2011 estimates:
Active surveillance: (public health officials actively gather data from state and local health departments, laboratories, hospitals, etc.)
- Foodborne Diseases Active Surveillance Network (FoodNet)
Passive surveillance: (public health officials rely on state and local health departments, laboratories, hospitals, etc. to report data to surveillance systems)
- National Notifiable Diseases Surveillance System (NNDSS)
- National Tuburculosis Surveillance System (NTSS)
- Public Health Laboratory Information System
- Cholera and other Vibrio Illness Surveillance System (COVIS)
Outbreak surveillance:
- Foodborne Disease Outbreak Surveillance System
Surveys:
- FoodNet Population Survey
- FoodNet Laboratory Survey
- National Ambulatory Medical Care Survey (NAMCS)
- National Hospital Ambulatory Medical Care Survey (NHAMCS)
- National Hospital Discharge Survey (NHDS)
- National Health and Nutrition Survey (NHANES)
- Nationwide Inpatient Sample (NIS)
Vital (Government) Statistics
- Multiple-cause-of-death data (from US death certificates)
- US Census
Tables 6a and 6b from Scallan et al. provide detailed descriptions of the data sources.
Table 6a. Data sources used to estimate illnesses, hospitalizations, and deaths due to known foodborne pathogens in the United States, 2011 (from Scallan et al.)
| Data Source | Data | Pathogen(s) | Geographic Coverage | Time Frame | Adjustments |
|---|---|---|---|---|---|
| Cholera and Other Vibrio Illness Surveillance System (COVIS)* | Number of case-patient reports, proportion hospitalized, proportion who died | Vibrio cholerae, toxigenic; Vibrio vulnificus; Vibrio parahaemolyticus; other Vibrio spp. | United States | 2000–2007 | Underreporting; Under-diagnosis |
| Foodborne Diseases Active Surveillance Network (FoodNet) | Number of laboratory-confirmed illnesses, proportion hospitalized, proportion who died | Campylobacter spp.; Cryptosporidium spp.; Cyclospora cayetanensis; Shiga toxin–producing Escherichia coli O157; Shiga toxin-producing E.coli non-O157; Listeria monocytogenes; non-typhoidal Salmonella; Salmonella serotype Typhi; Shigella spp.; Yersinia enterocolitica | FoodNet sites‡ | 2005–2008 | Geographical coverages§; Under- diagnosis |
| Foodborne Disease Outbreak Surveillance System (FDOSS) | Number of foodborne outbreak-associated illnesses | Bacillus cereus; Clostridium perfringens; Enterotoxigenic Escherichia coli; Staphylococcus aureus; Streptococcus spp., Group A | United States | 2000–2007; (Streptococcus spp.,Group A 1996–2007)† | Underreporting; Under-diagnosis |
| Proportion hospitalized and proportion who died in foodborne outbreaks | Bacillus cereus; Clostridium perfringens; Enterotoxigenic Escherichia coli; Staphylococcus aureus; Streptococcus spp., Group A; Clostridium botulinum; Trichinella spp. | United States | 2000–2007; (Streptococcus spp.,Group A1981–2007)† | Under-diagnosis | |
| Nationwide Inpatient Sample (NIS) | Hospitalization rate | Giardia intestinalis (ICD-9-CM code 007.1), Toxoplasma gondii (ICD-9-CM codes 130.0-9) | Sample of discharge records from US hospitals | 2000–2006 | Weighted to give national estimates according to Healthcare Cost and Utilization Project (HCUP) criteria; Under-diagnosis(Giardia intestinalis and Toxoplasma gondii ) |
| Death rate | Giardia intestinalis (ICD-9-CM code 007.1), Toxoplasma gondii (ICD-9-CM codes 130.0-9) | Sample of discharge records from US hospitals |
2000–2006 |
Under-diagnosis | |
|
National Health and Nutrition Examination Survey (NHANES) |
Seroprevalence |
Toxoplasma gondii |
United States | 1999–2004 | Rate of infection over time and percentage symptomatic |
| National Notifiable Diseases Surveillance System (NNDSS) | Number of case-patient reports | Brucella spp.; Clostridium botulinum (foodborne); Trichinella spp.; Hepatitis A; Giardia intestinalis | United States | 2000–2007 (2002–2007 for Giardia intestinalis)# | Underreporting; Under-diagnosis |
| Hospitalization rate | Hepatitis A | United States | 2000–2007 | Under-diagnosis | |
| National Tuberculosis Surveillance System (NTSS) | Number of tuberculosis case-patient reports, proportion who died | Mycobacterium bovis | United States | 2004–2007 | Percentage of tuberculosis cases attributable to M.bovis; under-diagnosis |
| US Census | Population estimates | Astrovirus, rotavirus, sapovirus | United States | 2006 | 75% of children experience an episode of clinical illness by 5 years of age |
| Various acute gastroenteritis data sources (see Table 6b) | Acute gastroenteritis illnesses, hospitalizations, and deaths | Norovirus | See Table 6b | See Table 6b | Fraction of acute gastroenteritis attributable to norovirus |
* Passive surveillance from COVIS was used in preference to active surveillance from FoodNet for Vibrio spp. because most illnesses are reported by Gulf States (Florida, Alabama, Louisiana, Texas) that are not included in the FoodNet surveillance area.
‡ Beginning in 2000, there were 10 FoodNet sites. In 2008, the population of these sites was 46 million persons, 15% of the US population.
§ Incidence of laboratory-confirmed illnesses in FoodNet from 2004 to 2007 was applied to the 2006 US Census population estimates.
† Data from FDOSS on Streptococcus spp., Group A were included from 1996 to 2007 for illnesses and from 1981 to 2007 for hospitalizations and deaths because of a paucity of data (Appendix 1 and 3).
# Giardia intestinalis became nationally notifiable in 2002.
Table 6b. Data sources used to estimate illnesses, hospitalizations, and deaths due to acute gatroenteritis in the United States, 2011 (from Scallan et al.)
| Data source | Data | Definition | Geographic coverage | Time frame |
|---|---|---|---|---|
| FoodNet Population Survey | Rate of illness | Average annual rate of acute gastroenteritis was derived by multiplying the average monthly prevalence by 12, where an episode of acute gastroenteritis was defined as diarrhea (≥3 loose stools in 24 hours) or vomiting in the past month with both lasting >1 day or resulting in restricted daily activities. Persons with a chronic condition in which diarrhea or vomiting was a major symptom and persons with concurrent symptoms of cough or sore throat were excluded. | FoodNet sites‡ | 2000–2001, 2002–2003, 2006–2007 |
| Death certificates – Multiple-cause-of-death data from the National Vital Statistics System | Death rate | Norovirus; Acute gastroenteritis deaths were identified from the underlying or contributing cause of death classified by ICD-10 diagnostic codes A00.9–A08.5 (infectious gastroenteritis of known cause) A09 (diarrhea & gastroenteritis of presumed infectious origin); and K52.9 (noninfectious gastroenteritis &colitis, unspecified); excluding A04.7 (enterocolitis due to Clostridium difficile) & A05.1 (botulism)¶ | United States | 2000–2006 |
| National Ambulatory Medical Care Survey (NAMCS); National Hospital Ambulatory Medical Care Survey (NHAMCS) | Hospitalization rate | Norovirus; Acute gastroenteritis hospitalizations were identified from patient visits to clinical settings, including physician offices, hospital emergency and outpatient departments with a diagnosis of infectious enteritis ICD-9-CM diagnostic codes 001–008 (infectious gastroenteritis of known cause); 009 (infectious gastroenteritis); 558.9 (other and unspecified noninfectious gastroenteritis and colitis), or 787.9 (other symptoms involving digestive system: diarrhea); [excluding 008.45 (Clostridium difficile colitis) and 005.1 (botulism)¶] or reason for visit classification codes for diarrhea (1595) or gastrointestinal infection (1540) resulting in hospitalization.¶ | Nationally representative sample of US clinical settings | 2000–2006 |
| Nationwide Inpatient Sample (NIS) | Hospitalization rate | Norovirus; Acute gastroenteritis hospitalizations were identified from discharges with one of the first three listed diagnoses classified by ICD-9-CM diagnostic codes 001–008 (infectious gastroenteritis of known cause); 009 (infectious gastroenteritis); 558.9 (other and unspecified noninfectious gastroenteritis and colitis), or 787.9 (other symptoms involving digestive system: diarrhea); excluding 008.45 (Clostridium difficile colitis) and 005.1 (botulism)¶. | Sample of discharge records from US hospitals | 2000–2006 |
|
National Hospital Discharge Survey (NHDS) |
Hospitalization rate | Norovirus. Acute gastroenteritis hospitalizations were identified from discharges with one of the first three listed diagnoses classified by ICD-9-M diagnostic codes 001–008 (infectious gastroenteritis of known cause); 009 (infectious gastroenteritis); 558.9 (other and unspecified noninfectious gastroenteritis and colitis), or 787.9 (other symptoms involving digestive system: diarrhea); excluding 008.45 (Clostridium difficile colitis) and 005.1 (botulism)¶. | Nationally representative sample of discharge records from US hospitals | 2000–2006 |
‡ Beginning in 2000, there were 10 FoodNet sites. In 2008, the population of these sites was 46 million persons, 15% of the US population.
¶ Codes for other and unspecified noninfectious gastroenteritis and colitis were included because infectious illnesses of unknown etiology are sometimes coded as noninfectious.
References
- Page last reviewed: July 16, 2016
- Page last updated: July 16, 2016
- Content source: