

Fluoridation Growth
 ShareCompartir
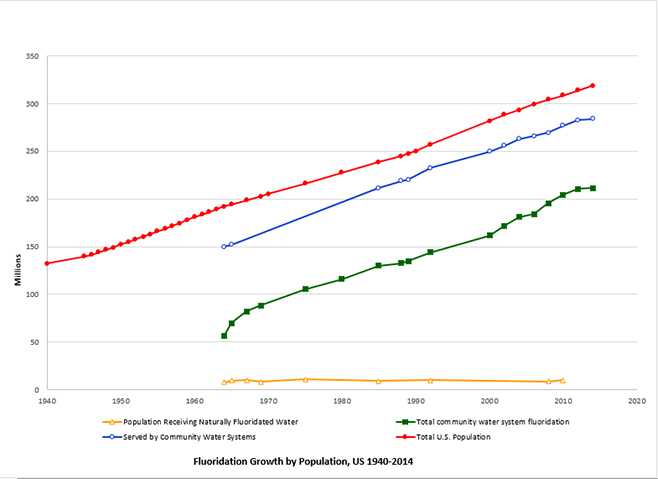
Fluoridation Growth Data Table
| Year | Receiving Fluoridated Water (Natural) |
Receiving Fluoridated Water (Total) |
Served by Community Water Systems |
Total U.S. Population |
Percentage of U.S. population receiving fluoridated water* | Percentage of population served by community water systems receiving fluoridated water |
|---|---|---|---|---|---|---|
| 2014 | 211,393,167 | 284,099,832 | 318,857,056 | 66.3 | 74.4 | |
| 2012 | 210,655,401 | 282,534,910 | 313,914,040 | 67.1 | 74.6 | |
| 2010 | 10,077,922 | 204,283,554 | 276,607,387 | 308,745,538 | 66.2 | 73.9 |
| 2008 | 8,805,304 | 195,545,109 | 269,911,707 | 304,059,724 | 64.3 | 72.4 |
| 2006 | 184,028,0381 | 265,794,2521 | 299,398,4842 | 61.5 | 69.21 | |
| 2004 | 180,632,4811 | 262,690,0431 | 293,638,1582 | 61.5 | 68.81 | |
| 2002 | 172,209,7351 | 255,434,2891 | 288,125,9732 | 59.0 | 67.31 | |
| 2000 | 161,924,0801 | 249,671,2491 | 282,216,9522 | 57.4 | 65.81 | |
| 1992 | 10,011,8613 | 144,217,4763 | 232,438,0003 | 256,894,0004 | 56.1 | 62.03 |
| 1990 | 250,132,0004 | |||||
| 1989 | 135,256,7575 | 220,179,0005 | 247,342,0004 | 54.7 | 61.45 | |
| 1988 | 132,422,0646 | 218,924,0006 | 245,021,0004 | 54.0 | 60.56 | |
| 1985 |
9,005,2627 |
130,172,3347 | 211,730,8737 | 238,466,0004 | 54.6 | 61.57 |
| 1980 | 115,948,9468 | 227,726,0004 | 50.9 | |||
| 1975 |
10,711,0499 |
105,338,3439 | 215,973,0004 | 48.8 | ||
| 1970 | 205,052,0004 | |||||
| 1969 | 8,378,82410 | 88,475,68410 | 202,677,0004 | 43.7 | ||
| 1967 | 10,009,00011 | 81,925,70011 | 198,712,0004 | 41.2 | ||
| 1965 | 9,775,10012 | 69,630,10012 | 152,192,00012 | 194,303,0004 | 35.8 | 45.8 |
| 1964 | 7,706,00013 | 56,069,10013 | 150,277,00013 | 191,889,0004 | 29.2 | 37.3 |
| 1963 | 189,242,0004 | 24.7 | ||||
| 1962 | 186,538,0004 | 23.6 | ||||
| 1961 | 183,691,0004 | 23.0 | ||||
| 1960 | 180,671,0004 | 22.8 | ||||
| 1959 | 177,830,0004 | 22.3 | ||||
| 1958 | 174,882,0004 | 22.0 | ||||
| 1957 | 171,984,0004 | 21.1 | ||||
| 1956 | 168,903,0004 | 20.1 | ||||
| 1955 | 165,931,0004 | 15.8 | ||||
| 1954 | 163,026,0004 | 13.7 | ||||
| 1953 | 160,184,0004 | 11.0 | ||||
| 1952 | 157,553,0004 | 8.8 | ||||
| 1951 | 154,878,0004 | 3.3 | ||||
| 1950 | 152,271,0004 | |||||
| 1949 | 149,188,0004 | |||||
| 1948 | 146,631,0004 | |||||
| 1947 | 144,126,0004 | |||||
| 1946 | 141,389,0004 | |||||
| 1945 | 139,928,0004 | |||||
| 1940 | 132,122,0004 |
Data Sources
- Centers for Disease Control and Prevention. Populations Receiving Optimally Fluoridated Public Drinking Water — United States, 1992–2006. MMWR 2008;57(no.27):737–741. Accessed on October 29, 2008. [Available online from: https://www.cdc.gov/mmwr/preview/mmwrhtml/mm5727a1.htm].
- U.S. Census Bureau. Annual Population Estimates, Estimated Components of Population Change and Rates of the Components of Population change for the United States and States: April 1, 2000 to July 1, 2006. Accessed on April 18, 2007. [Available online from: http://www.census.gov/popest/].
- Fluoridation Census 1992. Division of Oral Health, National Center for Prevention Services, Centers for Disease Control and Prevention, Public Health Service, U.S. Department of Health and Human Services. September 1993. Accessed on October 29, 2008. [Available online at: https://www.cdc.gov/fluoridation/pdf/statistics/1992.pdf [PDF–43M].
- Table HS-1. Population 1900 to 2002. U.S. Census Bureau. URL: http://www2.census.gov/library/publications/2004/compendia/statab/123ed/hist/hs-01.pdf [PDF–81K]. Accessed July 14, 2005.
- Fluoridation Census Summary, 1989. Dental Disease Prevention Activity, National Center for Prevention Services, Centers for Disease Control, Public Health Service, U.S. Department of Health and Human Services. July 1991. Accessed on October 29, 2008. [Available online at: https://www.cdc.gov/fluoridation/pdf/statistics/1989.pdf [PDF–8M]].
- Fluoridation Census Summary, 1988. Dental Disease Prevention Activity, Center for Prevention Services, Centers for Disease Control, Public Health Service, U.S. Department of Health and Human Services. February 1990. Accessed on October 29, 2008. [Available online at: https://www.cdc.gov/fluoridation/pdf/statistics/1988.pdf [PDF–866K]].
- Fluoridation Census, 1985. Dental Disease Prevention Activity, Center for Prevention Services, Centers for Disease Control, Public Health Service, U.S. Department of Health and Human Services. U.S. Government Printing Office Publication #1988-535-439. Accessed on October 29, 2008. [Available online at: https://www.cdc.gov/fluoridation/pdf/statistics/1985.pdf [PDF–42M]].
- Fluoridation Census, 1980. Dental Disease Prevention Activity, Center for Prevention Services, Centers for Disease Control, Public Health Service, U.S. Department of Health and Human Services. U.S. Government Printing Office Publication #1984-751-641, Region No. 4.
- Fluoridation Census, 1975. Dental Disease Prevention Activity, Bureau of State Services, Center for Disease Control, Public Health Service, U.S. Department of Health, Education and Welfare. U.S. Government Printing Office Publication #1977-740-116/3782, Region No. 4. Accessed on October 29, 2008. [Available online at: https://www.cdc.gov/fluoridation/pdf/statistics/1975.pdf [PDF–7M]].
- Fluoridation Census, 1969. Division of Dental Health, National Institutes of Health, U.S. Department of Health, Education, and Welfare. Natural Fluoride Content of Community Water Supplies, Division of Dental Health, NOH, DHEW. U.S. Government Printing Office Publication #1970-0-380-791. Accessed on October 29, 2008. [Available online at: https://www.cdc.gov/fluoridation/pdf/statistics/1969.pdf [PDF–5M]].
- Fluoridation Census, 1967. Division of Dental Health, National Institutes of Health, U.S. Department of Health, Education, and Welfare. U.S. Government Printing Office Publication #1968-0-310-023. Accessed on October 29, 2008. [Available online at: https://www.cdc.gov/fluoridation/pdf/statistics/1967.pdf [PDF–2.7M]].
- Fluoridation Census, 1965. Division of Dental Public Health and Resources, Public Health Service, U.S. Department of Health, Education, and Welfare. Accessed on October 29, 2008. [Available online at: https://www.cdc.gov/fluoridation/pdf/statistics/1965.pdf [PDF–1.5M]]
- Annual Fluoridation Census Report: National, State and Community Experience 1963. Division of Dental Public Health and Resources, Public Health Service, U.S. Department of Health, Education, and Welfare (DHEW).
Note: Fluoridation Censuses originally published only as paper documents, including several referenced above, are available online in PDF format at http://www.cdc.gov/fluoridation/statistics/reference_stats.htm. Archived paper copies were available for most, but not all, Fluoridation Censuses. The available copies were scanned and converted to PDFs.
* Estimates for percentage of U.S. population receiving fluoridated water were calculated differently for years before 1964, and since 1964. For years prior to 1964, the percentage was calculated by dividing the population receiving fluoridated water from systems adding fluoride (adjusted) by the total U.S. population. Since 1964, the percentage was calculated by dividing the population receiving fluoridated water from both adjusted and naturally fluoridated water systems by the total U.S. population.
- Page last reviewed: November 7, 2016
- Page last updated: November 7, 2016
- Content source: