ILI National Summary Detail
Back to A Late and Mild Flu Season.

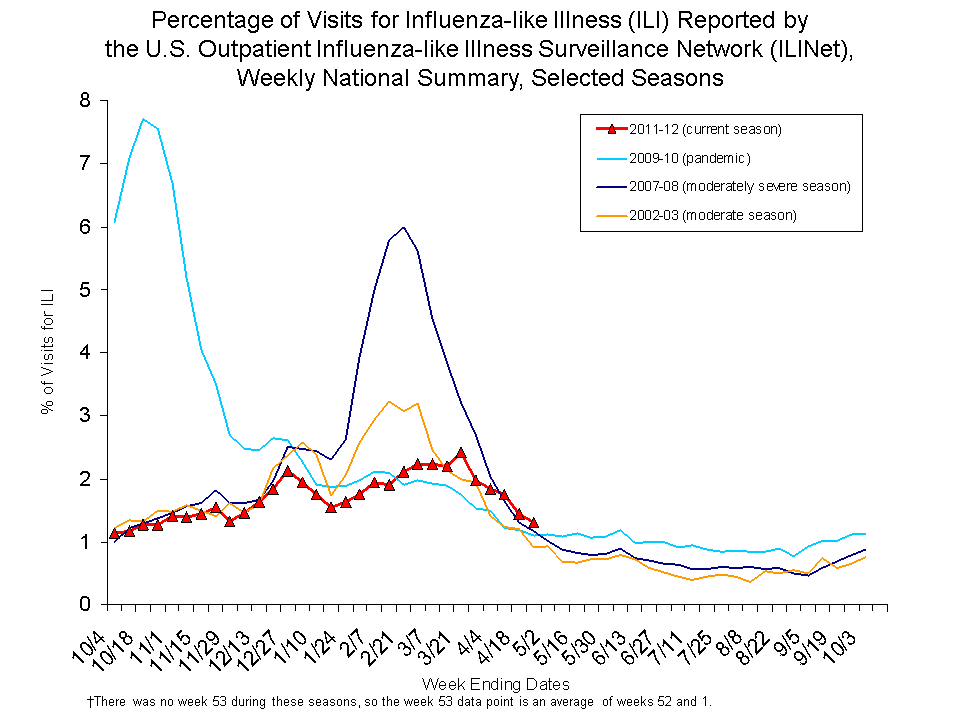
This line graph illustrates how influenza seasons can vary in severity by comparing the percentage of doctor visits for influenza-like illness (ILI) reported by the U.S. Outpatient Influenza-like Illness Surveillance Network (ILINet), by week, for four different influenza seasons. The seasons included are the 2002-2003 season (a moderate season), the 2007-2008 season (a moderately severe season), the 2009-2010 season (the season of the 2009 H1N1 pandemic), and the current 2011-2012 season.
As indicated by this graph, the 2011-2012 season has been mild in terms of ILI in comparison to the other seasons. For the 2002-2003 season, the percentage of doctor visits for ILI peaked at 3.2% around early February. During the 2007-2008 season the percentage peaked around mid-February at 6.0%. During the 2009 H1N1 pandemic the percentage of doctor visits for ILI peaked at 7.7% around late-October of 2009, fell drastically by late December, and evened out through October of 2010. For the current 2011-2012 season, doctor visits for ILI have been low overall, peaking at only 2.4% in mid-March.
Back to A Late and Mild Flu Season.
Top of Page- Page last reviewed: May 21, 2012
- Page last updated: May 21, 2012
- Content source:
- Centers for Disease Control and Prevention
- Page maintained by: Office of Associate Director of Communication, Division of Public Affairs


 ShareCompartir