

CDC: Flu Activity Expands; Severity Similar to Past H3N2 Seasons
 ShareCompartir
CDC recommends vaccination and rapid treatment with antiviral drugs for people at high risk from flu
January 5, 2015 – Flu continues to expand its reach in the United States this season, with the latest CDC FluView report showing that 43 states are experiencing either high or widespread flu activity, mostly resulting from circulation of drifted H3N2 viruses. Patient visits to doctors for influenza-like-illness (ILI) are now almost even with the peak of 2012-2013 season, the last time H3N2 viruses predominated. Relatively higher flu hospitalization rates seen so far this season are similar to what has been observed during some past H3N2-predominant seasons. CDC continues to encourage influenza vaccination and prompt treatment with flu antiviral drugs for people at high risk of serious flu complications, including people 65 and older, children younger than 5 years (and especially those younger than 2 years), pregnant women and any person with certain health conditions.
For the week ending December 27, 2014, ILI visits accounted for 5.9% of all clinic visits, and had been elevated for 6 consecutive weeks. For the past 13 seasons, ILI has remained elevated for between 1 and 19 weeks each season, with an average of 13 weeks.
Also for week 52, overall flu-related hospitalizations were 12.6 per 100,000 people, which is comparable to the 13.3 per 100,000 overall hospitalization rate seen during the same week of the 2012-2013 season, but higher than the 8.9 per 100,000 rate observed during week 52 of 2013-2014, which was an H1N1-predominant season. Hospitalization rates are almost always highest among people 65 years and older. During week 52 this season, the hospitalization rate for people 65 and older was 51.8 per 100,000 people. During week 52 of the 2012-2013 season, the hospitalization rate for people 65 and older was 52.8 per 100,000. During 2013-2014, it was 16.4 per 100,000. Hospitalization rates are cumulative, so this season’s rates will likely continue to rise. The end-of-season hospitalization rate for people 65 and older during 2012-2013 was 183.2 per 100,000.
Additionally, another 6 flu-associated pediatric deaths are being reported this week, bringing the total number of flu pediatric deaths that have been reported this season to 21. With the exception of the pandemic, the number of flu-associated pediatric deaths has ranged from 37 to 171 since 2004-2005, when pediatric flu deaths became nationally reportable.
Another indicator used to track deaths associated with influenza is the 122 Cities Mortality Reporting System — which tracks the total number of death certificates processed in 122 representative cities and the number of those for which pneumonia or influenza (P&I) is listed as the underlying or contributing cause of death. Last week P & I was at the "epidemic threshold" for that week (6.8%), meaning more deaths than expected were being seen, but this week, P & I is once again below epidemic threshold. Flu seasons typically follow a pattern where influenza-like illness rises, followed by increases in hospitalizations, which are in turn followed by an increase in reported of deaths. P & I is likely to rise again before the season concludes. During 2012-2013, P & I peaked at 9.9 percent. This was the highest recorded P & I in nearly a decade, but was comparable to recorded percentages for past severe seasons, including 2003-2004 when P&I reached 10.4 percent.
H3N2 viruses continue to predominate in the United States this season, accounting for more than 95 percent of all influenza reported to CDC from U.S. WHO and NREVSS collaborating laboratories. In the past, H3N2-predominant seasons have been associated with more severe illness and higher mortality, especially in older people and young children, relative to H1N1- or B-predominant seasons. Between 1976 and 2007, for example, CDC estimates that an average of 28,909 people died from flu during H3N2 seasons, compared to 10,648 people during non-H3N2 predominant years. Estimates of the number of flu deaths among people older than 18 are not available for this season. Only pediatric flu deaths are nationally reportable. CDC uses modeling to estimate the total number of deaths each season but this data won’t be available until after the season has concluded.
Most of the H3N2 viruses circulating are "drifted" or different from the H3N2 vaccine virus; suggesting that the vaccine’s ability to protect against those viruses may be reduced. Two factors play an important role in determining the likelihood that flu vaccines will protect a person from flu illness: 1) characteristics of the person being vaccinated (such as their age and health), and 2) the similarity or "match" between the flu viruses in the vaccine and those spreading in the community.
CDC conducts studies throughout each influenza season to help determine how well flu vaccines are working. These studies are called “vaccine effectiveness” studies or “VE” studies, for short. Recent studies by CDC researchers and other experts indicate that flu vaccine reduces the risk of doctor visits due to flu by approximately 60% among the overall population when the vaccine viruses are like the ones spreading in the community. If the viruses in the vaccine are different from circulating flu viruses, vaccine effectiveness can be lowered. For example, during 2007-2008, drifted H3N2 viruses circulated during the flu season. VE estimates against H3N2 during that season were 43%. CDC anticipates publishing vaccine effectiveness estimates for the current season in mid- to- late January.
CDC continues to recommend flu vaccination even when there are drifted viruses circulating because the vaccine can still prevent infection and also prevent serious flu-related complications in many people. Anyone who has not gotten vaccinated yet this season should do so now. This includes people who may already have gotten the flu this season because flu vaccines protect against three or four different viruses and it’s possible that other viruses will circulate later in the season. It’s fairly common for there to be two waves of flu activity during a season, the second wave is often caused by an influenza B virus. The Flu Vaccine Finder may be helpful locating vaccine.
As of December 5, 2014, an estimated 145.4 million doses of seasonal flu vaccine had been distributed. As of early November, only 40% of people in the U.S. had reported getting a flu vaccine this season. Final vaccine uptake estimates for this season are expected in the fall of 2015.
CDC also recommends flu antiviral drugs for treatment of influenza illness in people who are very sick with flu or people with the flu who are at high risk of serious flu complications. Influenza antiviral drugs are a second line of defense against the flu to treat flu illness. These prescription drugs work best when started soon after influenza symptoms begin (within 2 days), but persons with high-risk conditions can benefit even when antiviral treatment is started after the first two days of illness. People at high risk from flu should see a doctor if they develop flu-like symptoms. While doctors may prescribe antiviral drugs for non-high risk patients with flu, all high risk patients with suspected influenza should be receiving antiviral drugs. There are now three flu antiviral drugs approved and recommended for use this season: oseltamivir (Tradename Tamiflu®), zanamivir (Tradename Relenza®) and peramivir (Rapivab®), the latter is an intravaneous formulation approved for use in people 18 and older by the Food and Drug Administration (FDA) this season.
Nationally the country is likely to continue to experience several more weeks of flu activity as flu spreads to other states that have not yet had significant activity. Activity has been elevated in the Southern states for six weeks now. The mid-west saw increases in activity more recently. Most of the northeast and west of the country has yet to experience the full brunt of the flu season.
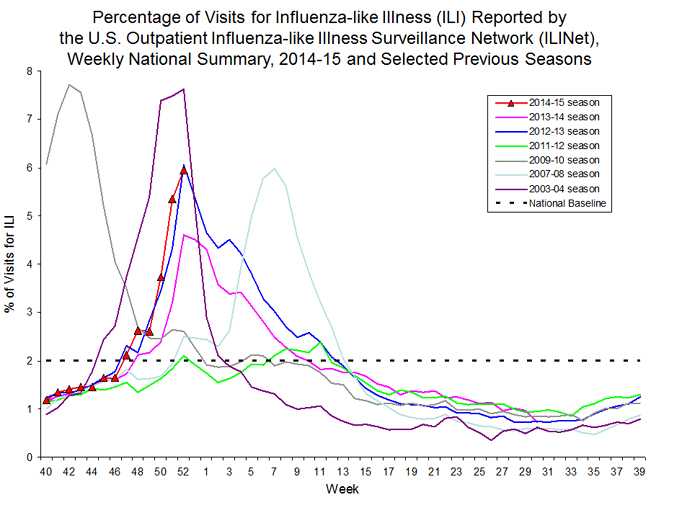
This graph compares data on influenza-like illness (ILI) collected by the U.S. Outpatient Influenza-like Illness Surveillance Network (ILINet) by week across seven different flu seasons (2003-2004, 2007-2008, 2009-2010 , 2011-2012, 2012-2013, 2013-2014 and the current season, 2014-2015.) The graph illustrates the fact that ILI activity for the current season (2014-2015 ) is most similar to ILI activity during the 2012-2013 flu season. H3N2 viruses were the predominant flu viruses reported during the 2003-2004, 2007-2008, 2011-2012 and 2012-2013 seasons and are currently the predominant flu viruses reported so far this season.
The 2003-2004 season had the highest ILI curve (as high as the pandemic). While 2007-2008 has a similar ILI trajectory to 2012-2013 and to the current season, that year the flu season did not begin until much later.
ILI is defined as fever (100⁰F or higher) and a cough and/or sore throat without a known cause other than flu. (The current national baseline of 2.0% was calculated for the 2014-2015 season and should not be used for previous flu seasons).
- Page last reviewed: January 6, 2015
- Page last updated: January 6, 2015
- Content source:
Error processing SSI file